Bait and switch - how social engineering terms combine with brand domains to lure users into online scams.
By Alex Deacon, Georgia Osborn
It is all about data
Improving access to data is foundational to how the DNS Research Federation achieves its mission “to advance the understanding of the Domain Name System's impact on cybersecurity, policy and technical standards”. The data available on and around the DNS is varied and numerous, yet finding, accessing and analysing this data has always been a challenge - even for those who are experts in the space. Over the past few months I’ve had the opportunity to spend time immersed in the capabilities of the DNS Research Foundation’s Data Analytics Platform (DAP.LIVE) and have been impressed not only by the data analytics capabilities it provides out of the box, but also the breadth and depth of data sources it makes available.
Kicking the Tyres
In order to truly understand the capabilities of the DAP it was important to me to “learn by doing”. How could I use the many data sources available in the DAP to better understand what this data can tell us? How could I tease out the interesting facts that such a large and varied set of data no doubt contains? This article is the first of many in which I will explore and demonstrate the capabilities and data available from the DAP. It is important to note that the process and methodologies I will use in this effort are not rigorously defined or vetted. They are simply a means to shine a light on both the data and capabilities that the DAP brings to the table.
Diving Deeper - Scam Data and Project Data Sources
The DNSRF home page includes a set of high level indices showing live metrics for several aspects of the DNS based on data contained within the DAP. Two of those indices show the number of reports of phishing and malware URLs over time. Understanding how these metrics change from day to day, month to month and year to year is the topic of much research elsewhere, so instead I thought I would take a look at the Global Anti-Scam Association’s ScamAdvisor data source that provides intelligence on domain names identified as being involved in scams.
Like most forms of abuse that involve domain names, scammers often use social engineering to lure users to click on or visit links. Typically this social engineering is driven by the inclusion of one or more call-to-action terms such as “login”, “support”, and “help”. In addition, in order to really get the attention of the user, they will also include a well known global brand name. Given this, I thought it would be interesting to use the DAP to answer a simple question - “What is the prevalence of domain names with both social engineering terms and brands in the ScamAdvisor data?”.
To answer this question I first imported a list of 14 social engineering terms into a local (private) project data source.
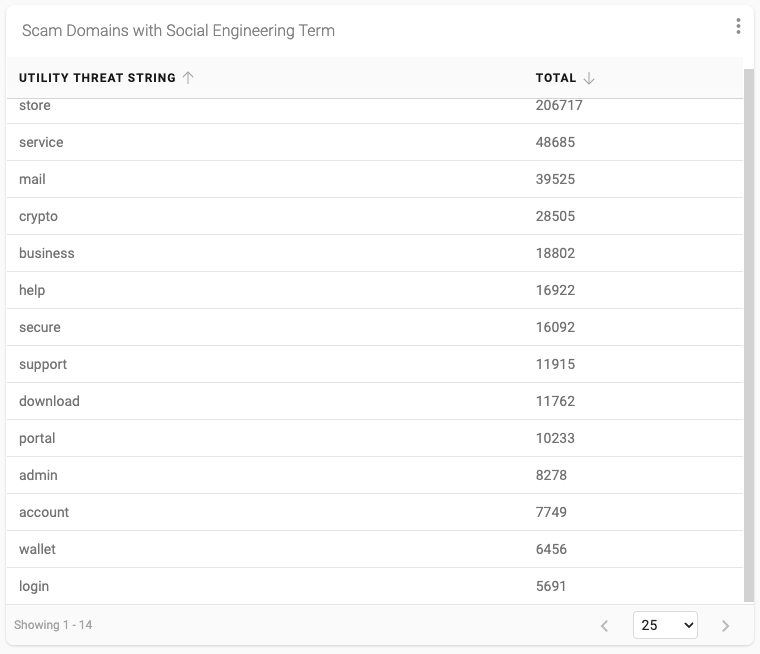
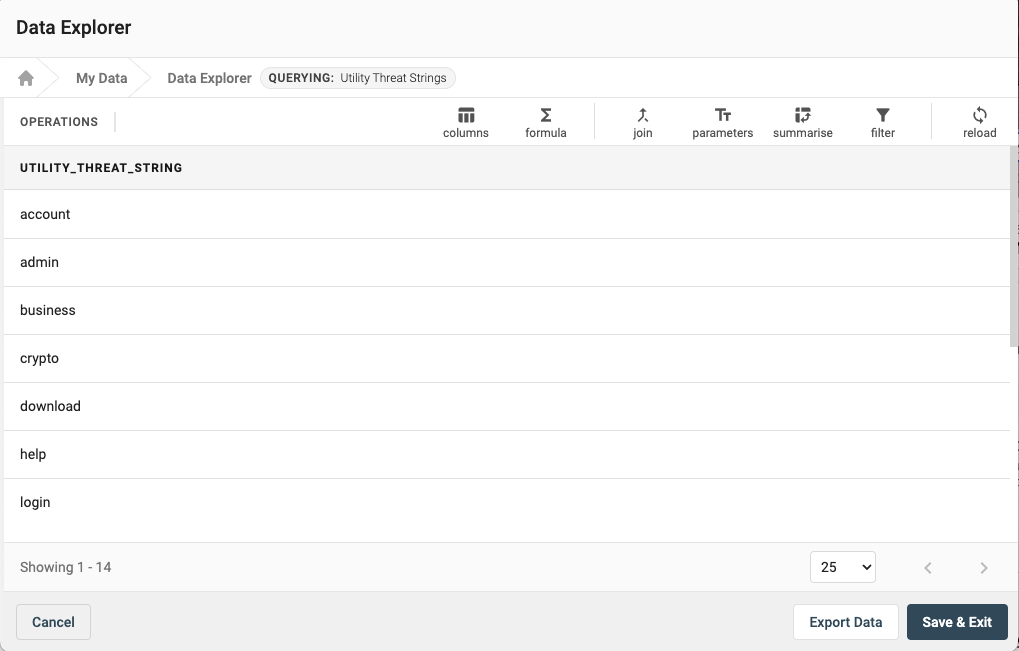 I then created a new stored query in the DAP to “join” my new table into the ScamAdvisor data starting from January 1, 2022. After summarising, filtering and sorting the result I ended up with the following data that indicates how many scam domains reported during that time period included one (or more) of the strings.
Next, using the native DAP dashboard functionality I created a pie chart to visualise this same data.
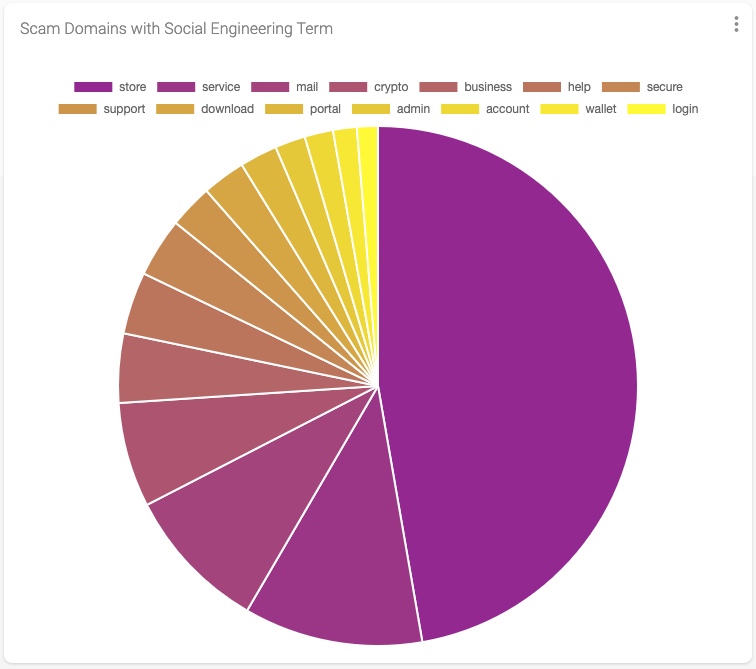
The resultant data shows 435,215 domains that include one or more of the fourteen social engineering terms. That represents roughly 3.5% of the total domains reported to the ScamAdvisor feed since the start of the year, with the term “store” at the top of the list representing just about 50% of all terms detected.
Now that I had a good understanding of the amount of scam domains that included one or more of the social engineering terms I wanted to see which of those also included a major brand. To do this I imported data associated with the top 100 most valuable global brands in 2022 into a second local (private) project data source. And similar to what I had done earlier I created a new stored query with this data extended from the previous query, resulting in the following output.
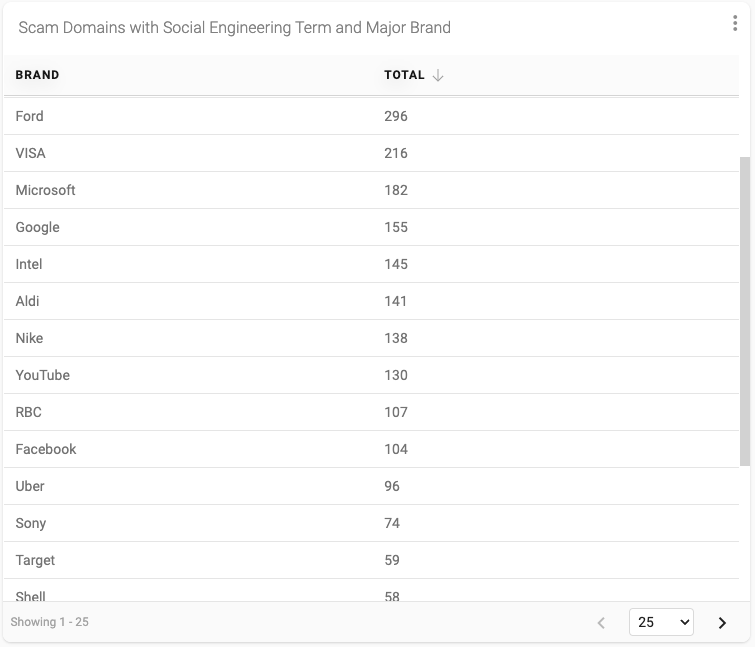
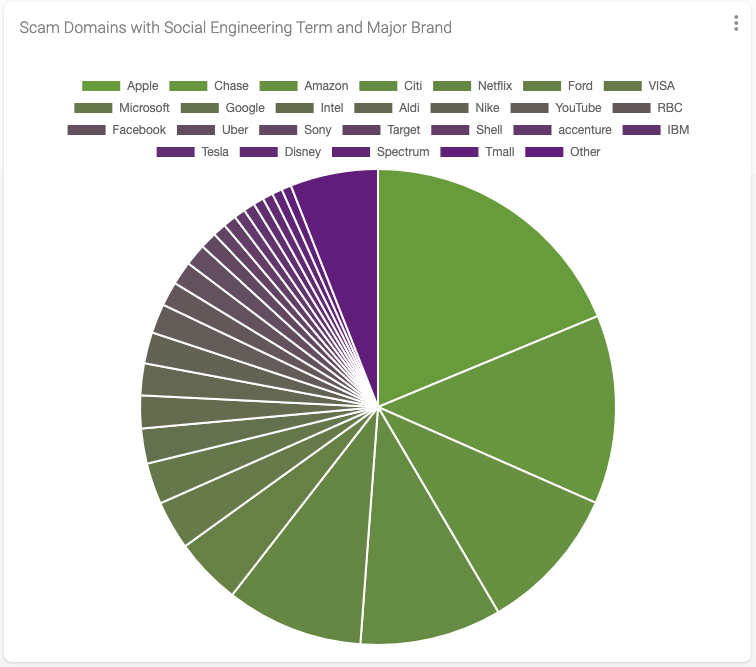
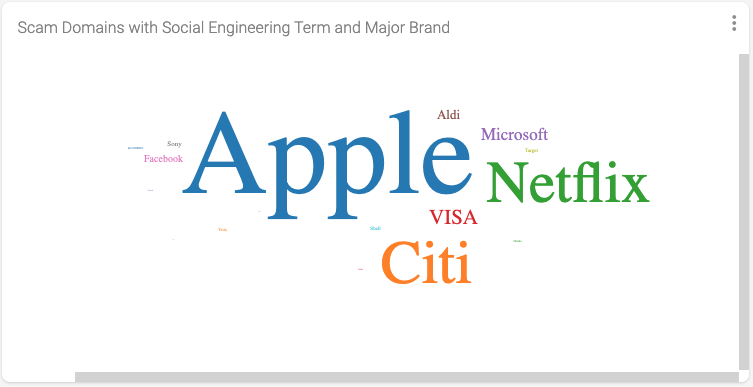
This query returned 6,541 unique domains that include both a social engineering term and a major brand. This result represents roughly 1.5% of the total number of domains that include a social engineering term. And we discovered that 59 of the top 100 most valuable brands were included in domain names reported as scams - with Apple, Chase, Amazon, Citi and Netflix sitting at the top of that list with the most hits.
Finally, I experimented with the “word cloud” visualisation functionality that also nicely depicts the results from my query.
Conclusion
This simple DAP experiment highlights several basic but useful DAP features.
- The ability for DAP users to import and manage their own private data sets. This data is only available to other users who have acces to a specific project, but can be also shared with other users in the account.
- The ability to create new stored queries by extending existing DAP provided data sources and joining private account data sources to gain further insights.
- The ability to apply standard data query mechanisms including joins, summarizations, filters and sort.
- The ability to visualise results via dashboards using various elements including Tables, Pie Charts and Word Clouds.
Using the DAP to answer our simple question we determined that, while the prevalence of scam domains that contain both social engineering terms and brand is numerically low, the occurrence across numerous brands and terms gives an interesting insight into how abusers use social engineering tactics along with major brands to lure more users into their scams.
It is clear to me that the DAP.LIVE tool will become central to those stakeholders who understand the importance of making technical, business, and policy decisions based on data, not conjecture.

