

DNS as a vector for phishing attacks, different victims, different methodologies, different results

By Alex Deacon
Summary
What is the right way of quantifying the role that the DNS plays as a vector for phishing attacks? Cybersecurity and DNS experts implement various methods for understanding the size and scale of this problem - some include all phishing URLs, others seek to isolate individual phishing attacks, and others exclude everything apart from individual domain names. Using the DNS Research Federation's DAP, we survey three methodologies commonly used to quantify and measure phishing. We find that while counting the number of distinct domains over time is an interesting metric in its own right, it is not an accurate indicator of the scale of phishing attacks, or the impact on victims. Because of this one should not conclude that if the count of distinct domains used in phishing attacks is trending down over time, that the impact of phishing on victims of cybercrime is also trending down, and vice versa. Our analysis shows that each method provides different insights, each has its own pros and cons, and using all three methods together gives a more rounded view on how phishing is experienced throughout the ecosystem. It also highlights a possible governance gap, as there is currently no standardized way to quantify, report or mitigate the high volume of phishing attacks mounted using third party sub-domain providers, whose services are being abused by bad actors.
Counting Phishing: Different Methodologies, Different Results
There are many different ways to quantify and measure abuse on the internet, and phishing in particular. How one counts abuse depends on several factors, including a specific definition of abuse, the kind of abuse (unfortunately there are many), who the victim of the abuse may be, and many others. In this Exploring DAP blog, we use the DAP to perform a comparison of three different methodologies used to quantify phishing.
- Counting Reported Phishing URLs
- Counting Phishing Attacks
- Counting Distinct Domain Names
For this survey, we used the new “DAP: Phishing Combined” data feed. This feed contains website URLs and associated metadata that have been identified as phishing sites from both the OpenPhish and APWG APIs. For this analysis, we have constrained the timeframe to the period January 1, 2023, and March 31, 2023.
As described in more detail below, all three counting methodologies are valid ways to quantify phishing. However, the results are all very different. Figure 1 visualizes the results of the three methodologies implemented using the DAP.
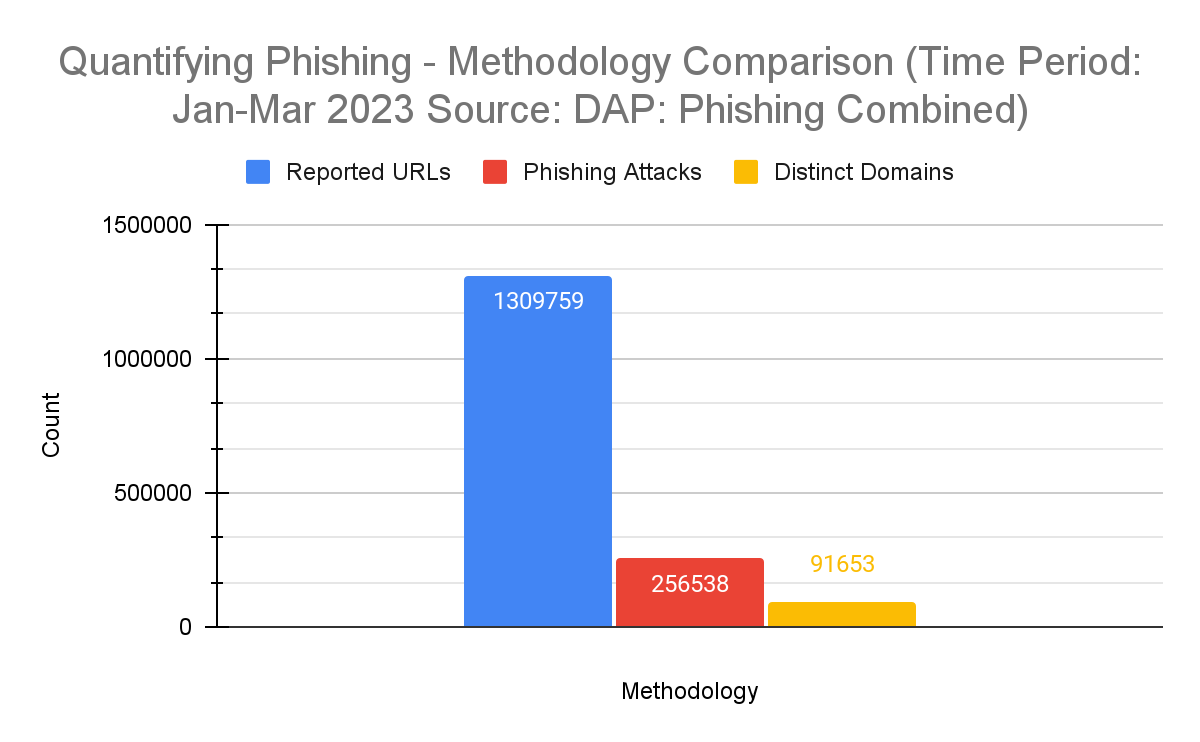
Figure 1 - Methodology Comparison Summary
In the sections below, we describe each methodology and point out the pros and cons of each.
Counting Reported Phishing URLs
This methodology is the easiest to implement, as it simply counts the number of reported phishing websites, in the form of URLs. Each URL represents a phishing attempt detected by the provider and published via their block list APIs. Given the use of multiple third (and higher) level domains by attackers and an unlimited supply of URLs for each, this count isn’t seen by experts in phishing abuse as an accurate representation of either direct user harm or the number of individual phishing attacks. A reason for this is that a single discrete phishing attack may use a single URL or many millions of randomly generated URLs all of which would lure victims to a single web site. Looking at reported URL data does, however, give an interesting insight into the numerous phishing attacks happening around the world at any given time, acting, if you will, as a canary in a coal mine.
Findings
For the time between January 1 and March 31, 2023, we counted 1,309,759 URLs reported by both OpenPhish and APWG feeds. [Note: In the combined phishing feed used for this analysis, URLs are deduplicated within a time window of one day.]
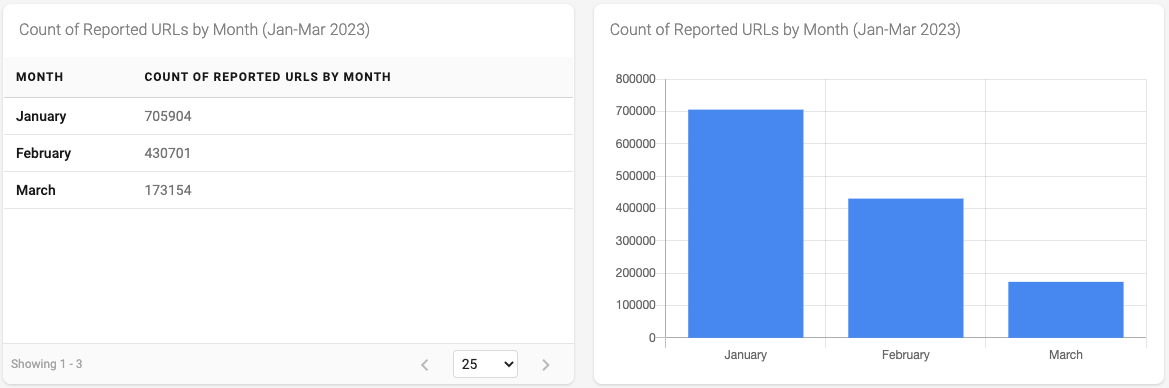
Figure 2 - Count of Reported URLs by Month
In Figure 2 we can see the number of reported URLs started high and then dropped dramatically by March. Looking closer at the data we discover a clue that might account for the spike in January.
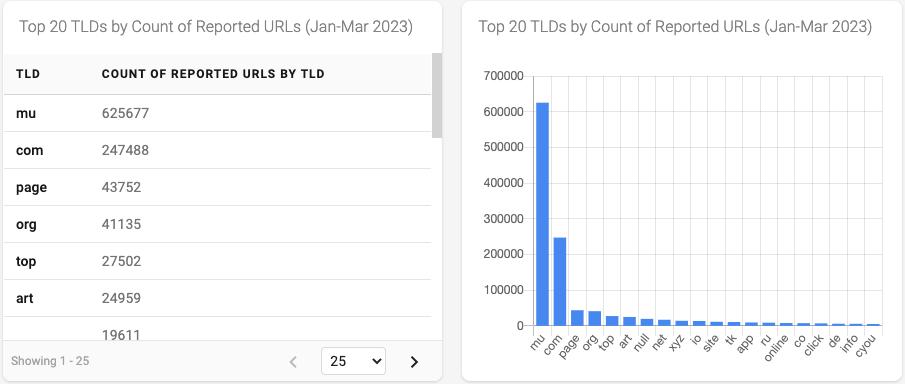 Figure 3 - Top 20 TLDs by Count of Reported URLs
Figure 3 indicates a spike in reported phishing URLs in the .mu TLD - almost three times the volume of .com, the next highest TLD. [Note: The blank/null value in Figure 3 and Figure 4 below indicates that the reported phishing URL was using an IP address instead of a domain name] Using more of the metadata available in our data set, specifically the domain name associated with each reported URL, we can gain additional insight.
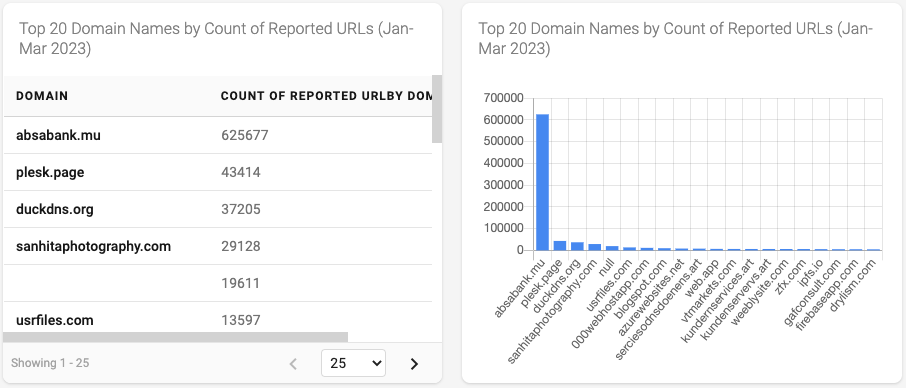
Figure 4 - Top 20 Domain Names by Count of Reported URLs
Figure 4 visualizes the number of reported phishing URLs by domain name. In this data, we can see the domain absabank[dot]mu was reported 625,677 times, fourteen (14) times higher than the next highest domain name, plesk.page.
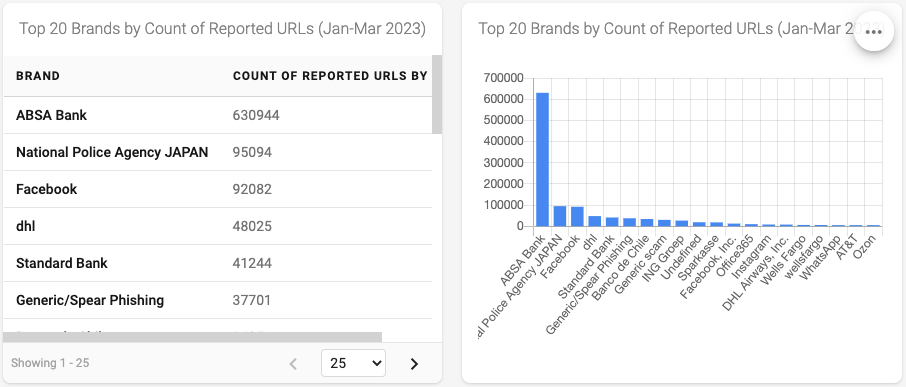
Figure 5 - Top 20 Brands by Count of Reported URLs
Finally, we can take a look at what brand has been reported to be associated with each URL, to see if that gives us any more clues. Figure 5 shows us that ABSA Bank was the brand most associated with reported phishing URLs for this period.
In summary, while counting reported URLs may not be a perfect way to quantify either phishing attacks or user harm, the data available in these feeds does provide many breadcrumbs for researchers to follow to come to a more concrete understanding of the methods and intermediaries used in the active phishing attacks launched during this time. As of the publication date of this blog, the website at absabank[dot]mu was no longer resolving, indicating this observed phishing incident has been mitigated.
Pros
- Counting Reported URLs is simple to calculate.
- “Spikes” in reported URLs can alert researchers that some form of phishing attack might be happening and that further analysis is required.
Cons
- Counting URLs is not seen to be an accurate measurement of phishing attacks or harm to users.
- High counts of reported URLs might over-inflate the significance of a phishing attack, i.e. a high number of reported URLs doesn’t necessarily mean a greater impact on internet users. In fact sometimes a single URL can have the same impact as many million URLs.
- Block List services often stop collecting and reporting URLs once they see related URLs that are associated with a discrete attack, so more URLs don’t necessarily mean a greater impact.
Counting Phishing Attacks
Several organizations within the security researcher community have developed ways of counting discrete “phishing attacks”. To count phishing attacks, researchers determine which URLs are found to be similar or related and group them into a single phishing attack. Organizations such as APWG and the Cybercrime Information Center (CIC) and vendors such as PhishLabs have independently developed and refined complex algorithms over the years to determine which set of reported URLs reflect a single attack on internet users.
For this survey, we have not developed such a complex algorithm. However, to arrive at a rough estimate of phishing attacks, we grouped all URLs with the same hostname (e.g. third-level.example.com) discovered during the timeframe of this study, and counted those URLs as a single phishing attack. This means that if 100,000 reported URLs used third-level.example.com we count that as a single phishing attack instead of 100,000 individual attacks. [Note: This method is not as fine-grained, elegant or accurate as the algorithms the experts use in their research, but it is a sufficient approximation for our purposes. As such, it may not reflect the true scale phishing attacks calculated by APWG, CIC and others.]
Findings
Using the simple phishing attack algorithm described above for the time between January 1 and March 31, 2023, we counted 256,538 separate phishing attacks. This value is roughly 5 times lower than the count of all reported URLs for the same time.
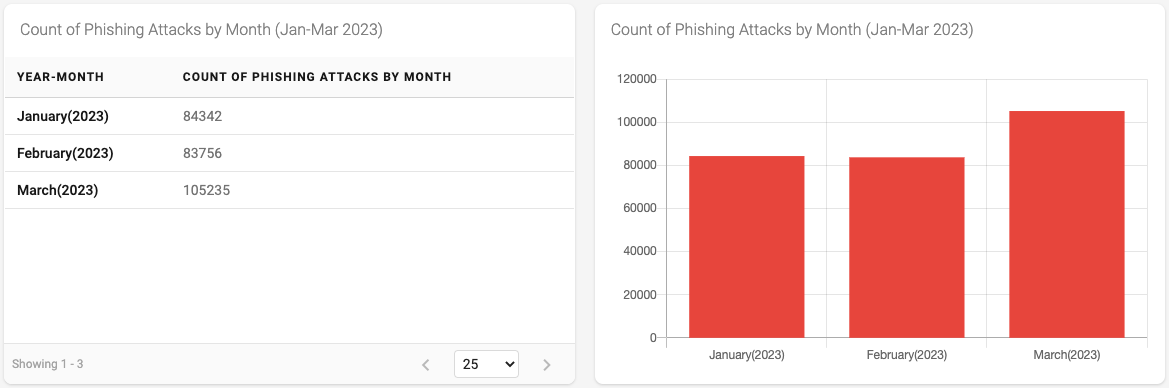
Figure 6 - Count of Phishing Attacks by Month
The counts of Phishing Attacks by month shown in Figure 6 is very different from the same time shown in Figure 2 in the previous section. We see that phishing attacks, as measured by our simple methodology, are steady in January and February and increase in March. [Note: We will not look at the details as to how and why this spike exists in this blog.]
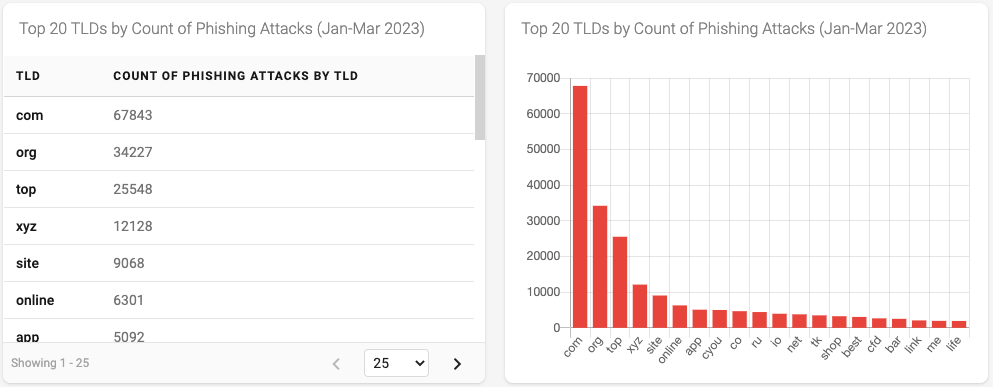
Figure 7 - Top 20 TLDs by Count of Phishing Attacks
The visualization of the top 20 TLDs used in Phishing Attacks shown in Figure 7 no longer contains the .mu TLD. This is because the phishing attack counting methodology compresses what was many thousand reported URLs into a single (or a small number) of phishing attacks. The TLDs and the corresponding number of phishing attacks seem to reflect a more accurate view of the distribution of phishing across the larger and more popular TLDs.
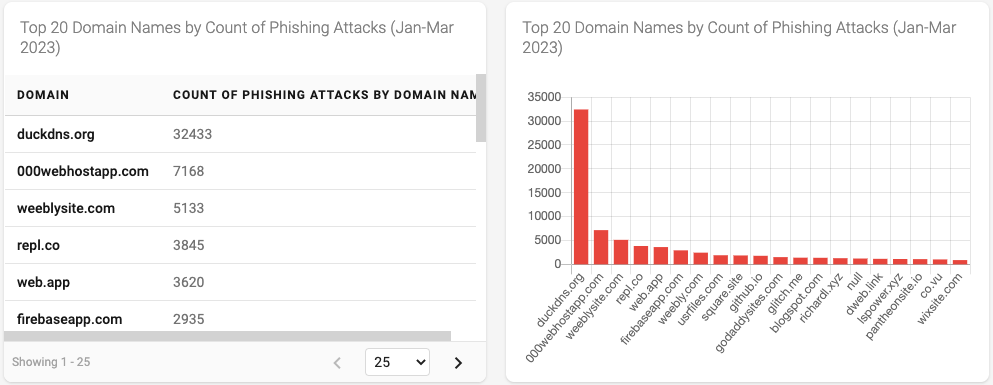
Figure 8 - Top 20 Domain Names by Count of Phishing Attacks
Similarly, when looking at phishing attacks by domain names we no longer see the absabank[dot]mu attack. The domain names we do see more accurately reflect the various subdomain, hosting and website service providers that are popular among attackers to launch phishing attacks. This includes sites such as duckdns.com, 000webhostapp.com, and blogapot.com to name a few.
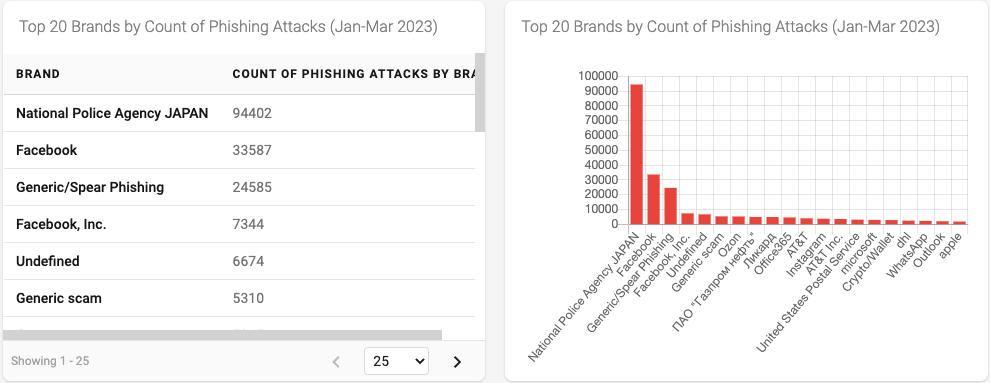
Figure 9 - Top 20 Brands by Count of Phishing Attacks
Finally, in Figure 9 we no longer see the ASBA Bank brand listed. What we do see is a set of brands that typically lead the list of brands used to lure internet users into phishing attacks (See this blog from earlier in the Exploring DAP series for more information related to this subject). In addition, we observe that the top brand associated with phishing attacks for this period of time is the National Police Agency JAPAN. While we won’t be diving into these details for this blog, it would be interesting to study if the spike in phishing attacks that happened in March is at all related to the spike of the use of this brand.
Pros
- Used by several respected security researchers and organizations, counting Phishing Attacks is a commonly understood, and thus more meaningful measure of the impact of phishing on internet users.
- Using this methodology, much of the “noise” associated with global large-scale phishing attacks, including how and when they are detected and reported, is normalized, reflecting a more accurate view of the phishing landscape.
Cons
- Calculating Phishing Attacks is challenging and complex. Security researchers have honed the algorithms they have developed based on their experience and the years of data they have at their disposal. For this survey, we approximated the count of phishing attacks using a simple method. Because of this, the counts of phishing attacks in this article may not reflect the true state or scale of phishing attacks reported elsewhere.
Counting Distinct Domain Names
The final methodology in our survey counts the unique/distinct domain names used in phishing. Used by both the DNS industry and security researchers alike, this methodology determines how many domain names (and only domain names) are used in various forms of abuse, including phishing.
For this survey, we have implemented the methodology published by Maciej Korczynski of Kor Labs for the DNS Abuse Institute, which not only counts unique domain names but also removes any reported URL containing an IP address or any domain names that registries or registrars are not able to mitigate directly. These include URL shorteners and subdomain provider services. Essentially this methodology quantifies only the abuse that the DNS industry can address itself and can mitigate directly. We believe the reports made available via ICANN’s Domain Abuse Activity Reporting (DAAR), use a similar methodology, although we cannot be sure as ICANN does not currently publish a detailed methodology for the DAAR.
Implementing this methodology was more complex than the previous methodologies, but the DAP was able to manage it quite easily. [The publication of such a clear methodology by Dr Korczynski offers others the ability to replicate his results, and we thank the colleagues at the DNS Abuse Institute for answering our queries on the methods.] We applied this methodology to the same data snapshot by performing the following steps:
- We removed any reported URL that contains an IP address.
- We removed any reported URL that is on the list of URL shorteners. URL Shorteners are services that provide URL forwarding/redirection services. These URLs are not abusive, but often these services are used by attackers to trick users.
- We removed any reported URL with a domain on the list of subdomain providers. Subdomain providers include dynamic DNS providers, subdomain providers, and file-sharing services. Again these websites are not necessarily abusive but are often abused by bad actors to facilitate cyberattacks against users.
- Finally, using the remaining URLs, we counted the number of distinct/unique domains they contained. Counting distinct/unique domains means that if the domain example.com appeared in 1000 reported URLs, it would be counted once, not 1000 times. f
Findings
Starting with the base data set of reported URLs, de-duplicated as described above, for the period between January 1 and March 31, 2023, we applied the methodology above, removing URLs until we ended up with a count of 91,154 unique domains.
Figure 10 visualizes the Reported URL count after each step listed above.
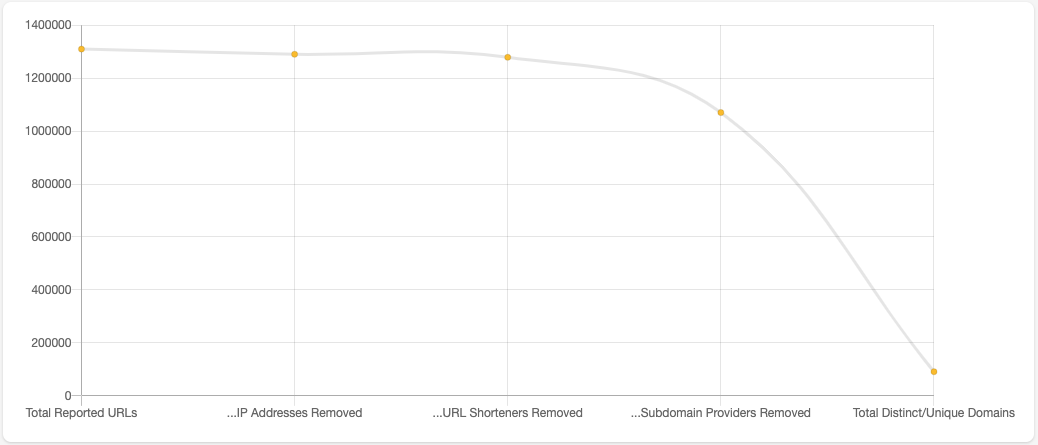
Figure 10 - Counts of Reported URLs as Methodology is Applied
We can see removing IP Addresses and URL shorteners resulted in a 2.4% reduction. Removing subdomain providers results in a further 15.9% reduction in the count. Counting the distinct domains from the set of remaining URLs gets the count down to 91,154 which is a decrease of 93% from the total reported URLs and a decrease of 91% of the reported URLs remaining.
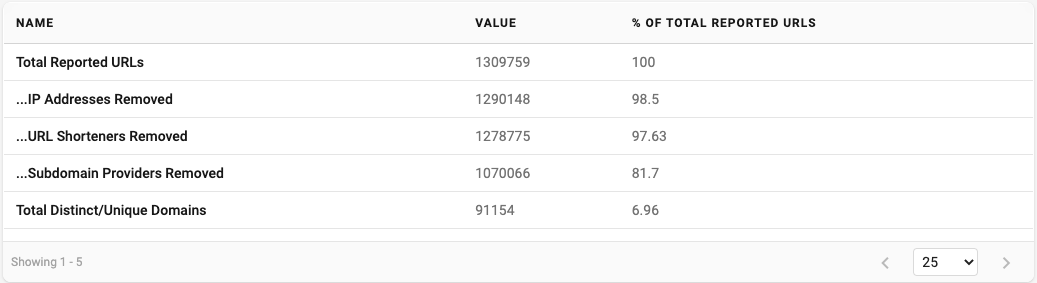
Figure 11 - Counts as a Percentage of Total Reported URLs.
We can also calculate the difference between the count of phishing attacks using the methodology above (256,538) and the count of distinct domain names calculated by this methodology (91,154). When we do, we find that the number of distinct domains is almost 3 times smaller than the number of phishing attacks.
We want to highlight an important fact. Comparing the results of these methodologies is like comparing apples to oranges as they count different things, by definition. While counting the number of distinct domains over time is an interesting metric in its own right,it is not an accurate indicator of the scale of phishing attacks, or the impact on victims. This is especially true given that important phishing-related data is removed from the data set before calculating the distinct domains. Because of this one should not conclude that if the count of distinct domains used in phishing attacks is trending down over time, that the impact of phishing on victims of cybercrime is also trending down, and vice versa. In fact, given the prevalence of subdomain providers used in attacks, the opposite might be happening.
Pros
- This methodology focuses on abuse that the domain name industry can address and even mitigate directly. e.g. registered domain names that might have been maliciously registered and are not managed by intermediaries like subdomain providers, URL shorteners, hosting providers, website hosters and the like.
- Analyzing the domains involved in incidents of phishing against users is an important metric in the domain name industry’s fight to mitigate abuse of users in general.
Cons
- While counting distinct domain names using this methodology is a valid way to quantify the number of domain names used to launch phishing attacks against users, it obscures the true size and scale of phishing attacks that users might encounter.
- This methodology highlights the fact that phishing attacks, and internet abuse in general, happen across multiple internet intermediaries. Everyone has a responsibility to address user abuse that might happen on their platforms and services. While the domain name industry works on policies to address abuse of the DNS, there seems to be a governance gap on how other service providers should detect and mitigate abuse of users.
The Impact of Removing Subdomain Providers
Diving a little bit deeper into the analysis above, we wanted to look at the impact of quantifying phishing when subdomain providers are not included. Typically these subdomain provider services are used by attackers to launch large-scale global phishing campaigns. There are a total of 944 subdomain provider domain names on the Kor Labs list we used to implement this methodology. Of those 944 subdomains, we found 453 in our snapshot of data for the three month period of this study.
Looking at the count of reported URLs in our data set (1,309,759) we found that 208,709 were using a subdomain provider. That is 16% of all total reported URLs.
Similarly, looking at the count of phishing attacks (256,538) we found that 91,011 were using a subdomain provider. That is 36% of all phishing attacks counted. This is significant as it results in over one-third of phishing attacks being ignored in methodologies that focus solely on unique domain names.
We wanted to better understand which subdomain providers are being used in our dataset, resulting in Figure 12.
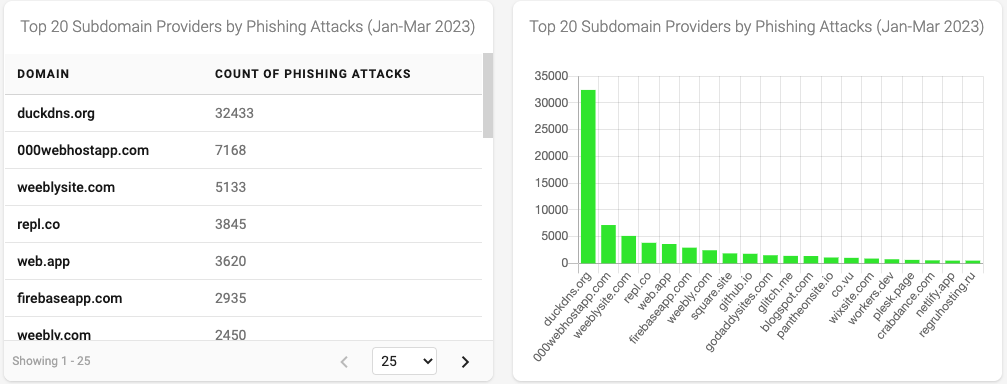 Figure 12 - Top 20 Subdomain Providers by Phishing Attacks
This graph seems to indicate that duckdns.org (a Dynamic DNS provider), was being used to launch a major phishing attack during the first quarter of 2023.
duckdns.org
Diving deeper into the data associated with duckdns.org, we find that the count of reported URLs and the count of phishing attacks are quite similar. This indicates that attackers had created tens of thousands of randomly generated third-level domain names under duckdns.org for their phishing attack.
- Count Of Reported URLs = 37,206
- Count Of Phishing Attacks = 32,433
- Count of Distinct Domains = 0
The duckdns.org domain name, and thus all of the duckdns.org attacks, are not included in the methodology used to count distinct domains.
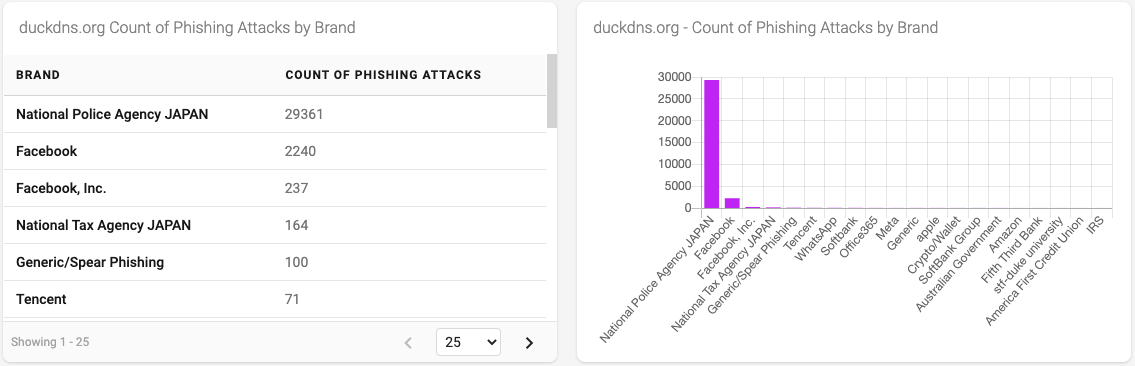 Figure 13 - Top 20 Brands used in duckdns.org phishing attacks
Finally, looking at the brand associated with the duckdns.org-based phishing attacks, we see that the National Policy Agency JAPAN is way out in front - which is the same data we saw in the phishing attack methodology analysis above.
000webhost
Looking closer at the 000webhost subdomain provider we again see a large number of attacks, which are not accounted for in the distinct domain methodology.
- Count Of Reported URLs = 11577
- Count Of Phishing Attacks = 7168
- Count of Distinct Domains = 0
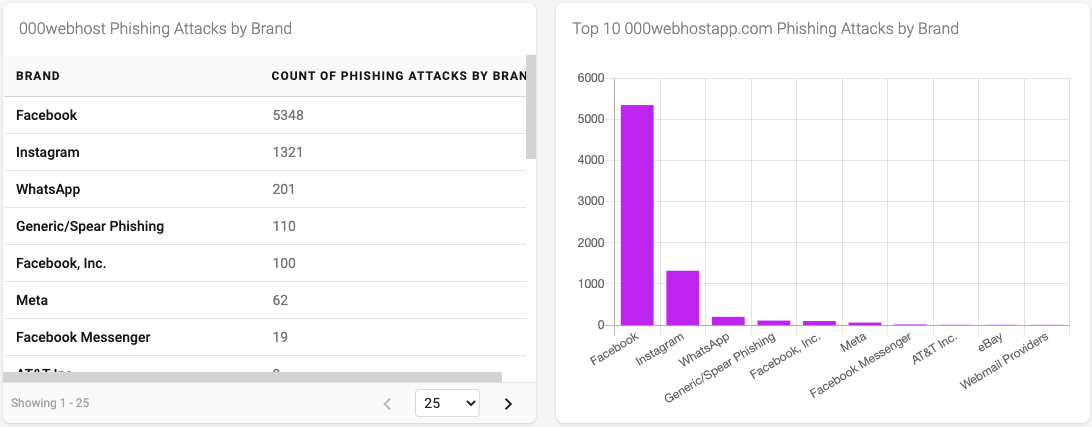
Figure 15 - Top 10 Brands used in 000webhost phishing attacks
Reviewing the brands associated with the 000webhost attacks, we see a more typical set of large commercial brands often used to lure users into clicking on links. (see also. Blog: Bait and switch - how social engineering terms combine with brand domains to lure users into online scams.)
Conclusion
The robust analytics functionality of the DAP in conjunction with the data feeds it contains, provides an opportunity to understand and better appreciate how phishing, and abuse in general, can be measured. The methodologies described above each tell a valid story but each story is focused on a different subject and counts different things. When counting phishing attacks, the story spotlights how internet users are abused. When distinct domains are counted, a completely different story is told, one focused on determining which domain names are being used to launch attacks against internet users. Specifically, this method identifies the malicious domain names that fall within the sphere of influence of domain registrars and registries.
As mentioned above, we find that comparing the results of these methodologies is like comparing apples to oranges as they quantify and count very different things. While counting the number of distinct domains over time is an interesting metric in its own right, it is not an accurate indicator of the scale of phishing attacks, or the impact on victims. Because of this one should not conclude that if the count of distinct domains used in phishing attacks is trending down over time, that the impact of phishing on victims of cybercrime is also trending down, and vice versa. In fact, given the prevalence of subdomain providers used in attacks, the opposite might be happening. Our analysis shows that each method provides different insights, each has its own pros and cons, and using all three methods together gives a more rounded view on how phishing is experienced throughout the ecosystem.
Finally, we found that using the DAP to perform this analysis was straightforward. We created fifty (50) separate DAP stored queries to analyze and collect the required data. In addition, we made extensive use of the DAP’s dashboard and visualization functionalities - which we have screenshotted and included in this blog.
Notes on Methodology
- For this survey, we approximated the count of phishing attacks using a simple method. Because of this, the counts of phishing attacks in this article may not reflect the true state or scale of phishing attacks reported elsewhere
- In this analysis, we did not distinguish between maliciously registered and compromised domains.
- The process and methodologies used have not been rigorously vetted or peer\-reviewed. They are simply a means to shine a light on both the data and capabilities that the DAP brings to the table.
Join the discussion
#phishing #dns #exploringDAP