

Protecting Your Brand: A Comprehensive Guide to DAP for Brand Monitoring
By Alex Deacon
Summary
Using the DAP’s native capabilities, we describe how to quickly and easily build a high-level dashboard to visualize recent activity for a particular string (typically a brand name or trademark) across three important vectors: domain name registrations, blockchain registrations, and newly observed DNS queries.
Leveraging the Power of the DAP for Brand Monitoring
The DNS Research Federations DNS Analytics Platform (DAP.LIVE) is a powerful tool to analyze and visualize the data it contains. Previous articles have focused on teasing out interesting facts in various DAP data feeds. I thought I would shift gears for this article and highlight several of the DAP’s native visualization and dashboarding features. To accomplish this, I describe how I used the DAP to build a simple yet effective dashboard to summarize and spotlight recent registration and DNS query activity for the brand string “apple” as an example.
Monitoring for new registration and DNS query activity is the first step in a typical brand workflow. I won’t focus on the rest of that workflow in this article; however, filtering out activity known to be “real” based on a list of known/approved registrars or name server entries would be trivial. Similar filtering can be done using known Registrant IDs associated with blockchain domain registrations.
High-Level Dashboard
Typically, brand owners are interested in keeping on top of how their brands are being used or abused, as the case may be, on a daily basis. The DAP provides access to three different data feeds that allow users to gain this insight:
- Zone Files: Domain Change Log - This data feed contains newly registered or deleted domain names obtained by processing zone files from the gTLD and several country-code registries. It is updated daily.
- DAP: Blockchain Domain Records - This data feed contains all available Blockchain Records for the Ethereum and Unstoppable Domain providers. It is updated daily.
- Farsight: Passive DNS Records By Prefix - This feed contains all Passive DNS Records observed starting with a given prefix. It includes the record type and first and last observed dates. The passive DNS data is updated every two hours.
Using standard out-of-the-box DAP functionality, I quickly designed the dashboard below (Figure 1) to highlight key metrics for recent activity from each feed.
To see the Full sized Dashboard, click here
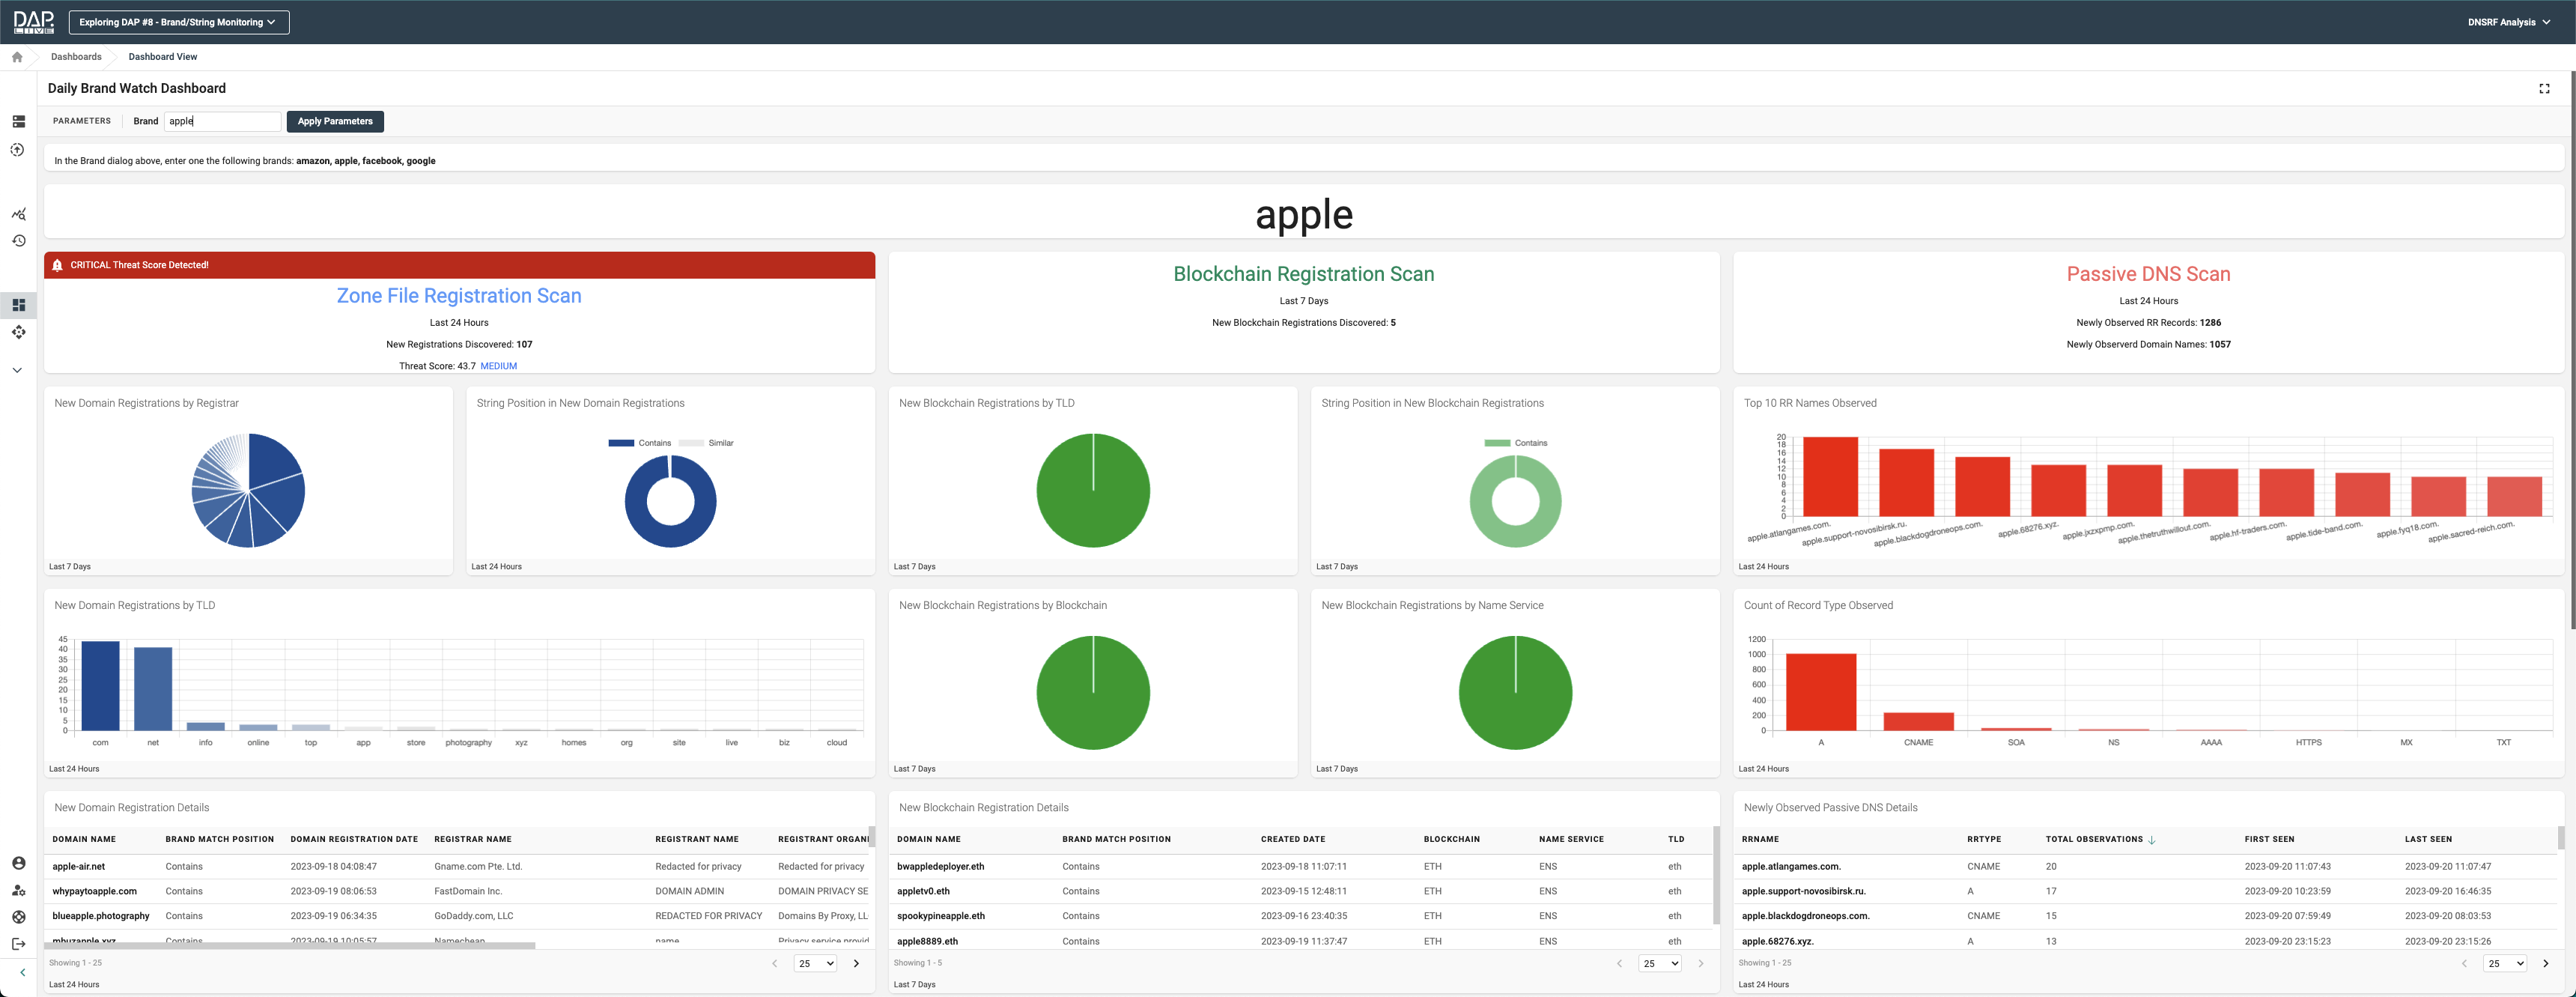
This dashboard summarizes zone file registration activity in the left-hand column, blockchain registrations in the center column, and details of passive DNS observations in the right-hand column. Each column starts with a high-level summary of recent activity and then displays several visualizations that further describe and detail that activity. At the bottom of each column is a table with the details of all activity for the period.
Scanning for Zone File Registrations
Updated with fresh information every 24 hours, the “Zone Files: Domain Change Log” data feed allows us to query how many new registrations have been added to the zone file for a given string for a given period. We capture the results of this query using the DAP “snapshot” functionality, which allows a stored query to be executed daily at a specified time. For this example, the snapshot happens daily at 08:00 UTC (00:00 Pacific time). In addition to the most recent snapshot, we can configure the DAP to store all previous/historical snapshots - allowing us to view changes in the results over time.
Beyond searching for the specific string “apple,” I designed this query to calculate the “String Position” in the domain name, i.e.
- Exact: The exact string, and only the string, is contained in the prefix of the domain name. (e.g. apple.com)
- Contains: The string appears somewhere in the prefix of the domain name. (e.g. pineapplecakeee.com)
- Similar: Using the Levenshtein Distance Algorithm, detect if the domain name prefix is similar to the brand name. (e.g. apploea.com) The Levenshtein Distance Algorithm helps detect strings that attackers can use for phishing and typo-squatting attacks.
The “String Position in New Domain Registrations” doughnut chart in Figure 2 below is used to visualize these findings. In addition, I used this data to calculate a “Threat Score” in the summary area at the top of the column. This threat score uses a custom formula, easily defined in the DAP, that creates a value using a weighted calculation of the number of exact, contains, and similar strings found for the period. Any score above 50 is determined to be a “High” threat, indicated in red using the custom HTML classes and tags.
Next, I joined the results with the “WhoisXML: Domain Registrar Data” feed, which provides real-time WHOIS information for a single domain. I was specifically interested in knowing what Registrar and Top Level Domains were associated with the domain names returned by my query. The “New Domain Registrations by Registrar” pie chart and the “New Domain Registrations by TLD” bar chart visualize these results.
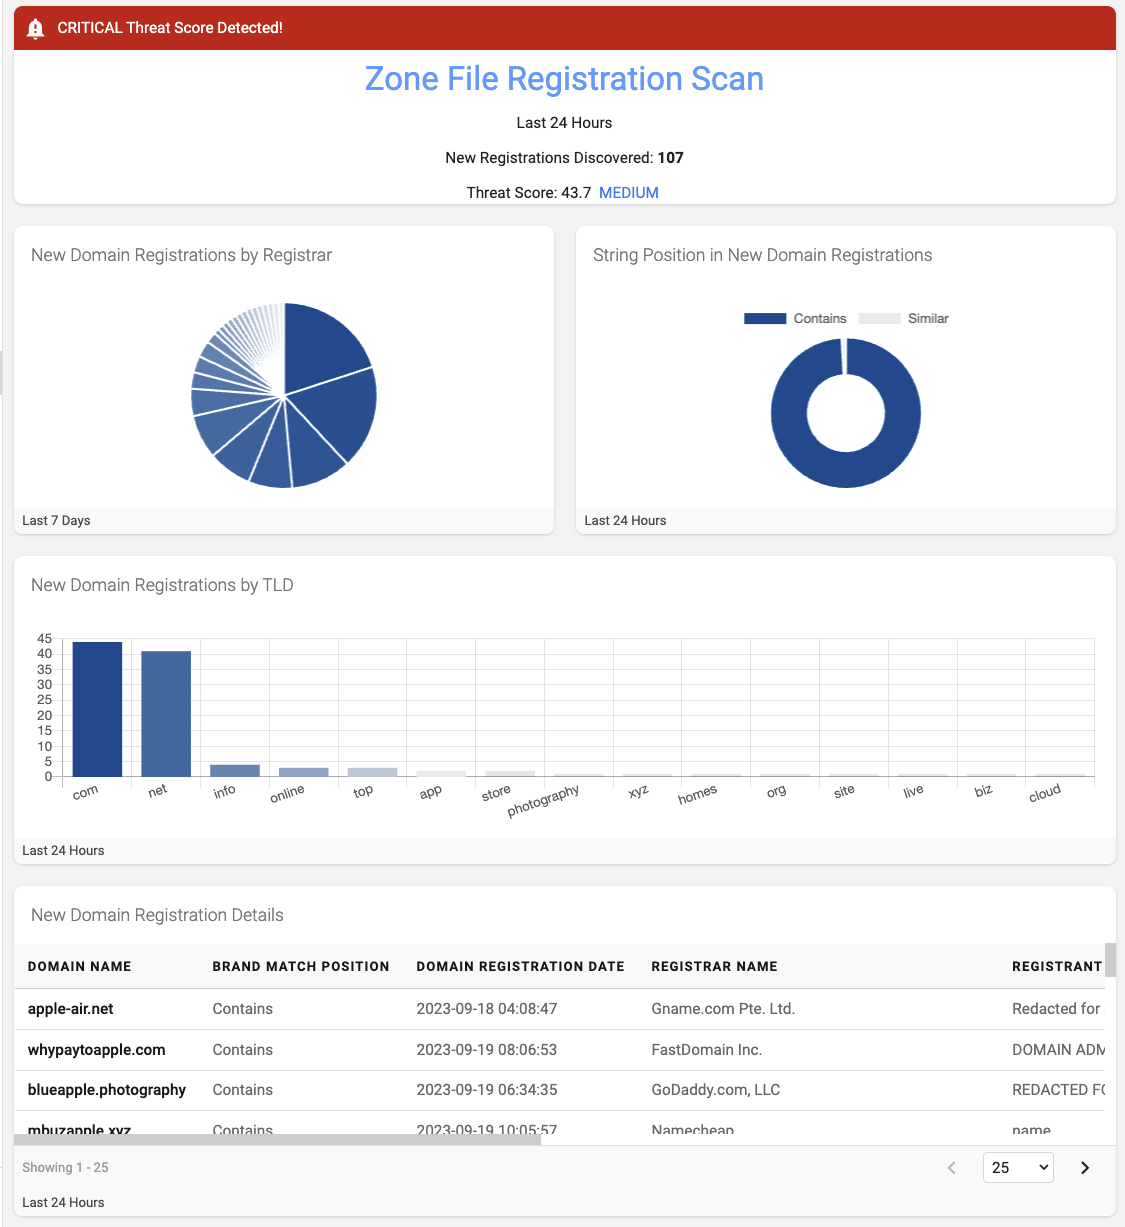
Finally, at the bottom of the column, I added a table with all the relevant data for each registration, allowing the user to dive into the details and export them to a local JSON or CSV file for further analysis.
Scanning for Blockchain Registrations
Using the “DAP: Blockchain Domain Records” data feed, I crafted a query similar to the one used above to look for instances of the brand string registered on the Ethereum and Unstoppable Domain services for the past seven days. I increased this search period from 24 hours to 7 days because a period of 24 hours often resulted in zero registrations. As described above, the results of this query are captured using the DAP “snapshot” functionality, which executes the stored query daily at 08:00 UTC.
Again, I calculated the “string position” of the brand in the blockchain domain names, including the Levenshtein Distance Algorithm, to detect strings that can be used for phishing or typo-squatting attacks. I then configured several pie charts (Figure 3) to visualize which TLD, Blockchain, and Blockchain Name Services were associated with the registrations found during the period.
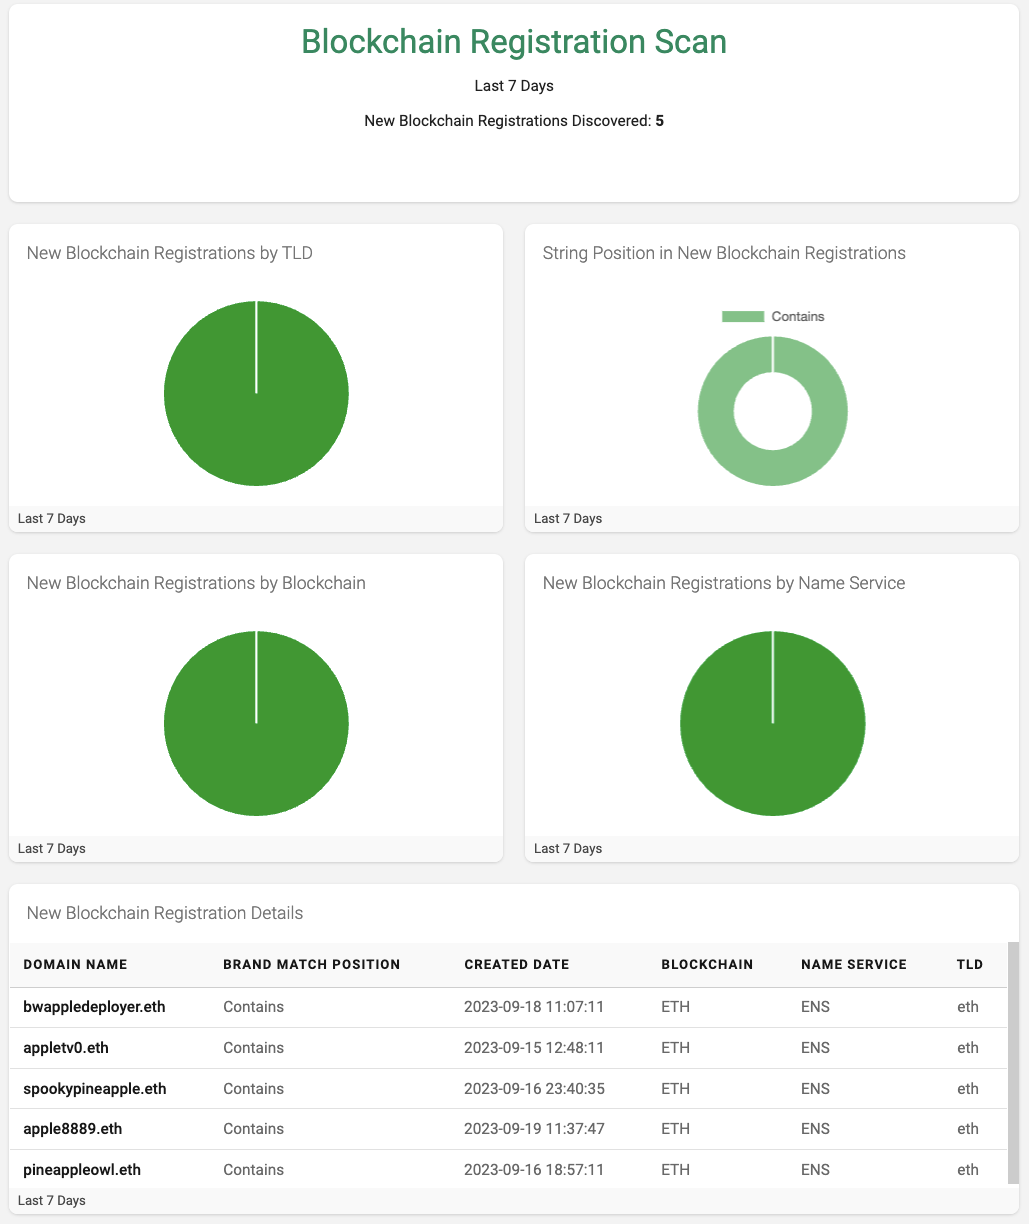
Finally, I included a table with the relevant details of each newly registered blockchain domain for further study and analysis.
Scanning the Passive DNS Traffic
Passive DNS is a data feed of DNS queries and the related responses collected in real time from various points on the internet. Unlike domain name or blockchain registration monitoring, which can only detect strings at the second level (e.g., example.com), passive DNS data includes the hostname from DNS queries at any level. Using passive DNS means detecting when a brand string is used at the third level (brand.example.com or brand.third.example.com) and beyond. Understanding when specific strings are used in DNS queries beyond the second level is a crucial threat intelligence tool.
The DAP hosts data refreshed from the Domain Tools (a.k.a Farsight) Passive DNS database every 2 hours. Using this data, we can scan for newly observed instances of the brand string in DNS queries for the past 24 hours. From this query, we gain insights into any DNS resource record that has been newly observed, including the hostname associated with the resource record and the resource record types. This data gives brand owners an indication of when their brand might be involved in abuse using internet infrastructure or service providers outside of the brand owners' direct control. (see Use of Subdomain Providers Gains Popularity as a Mechanism to Launch Phishing Attacks).
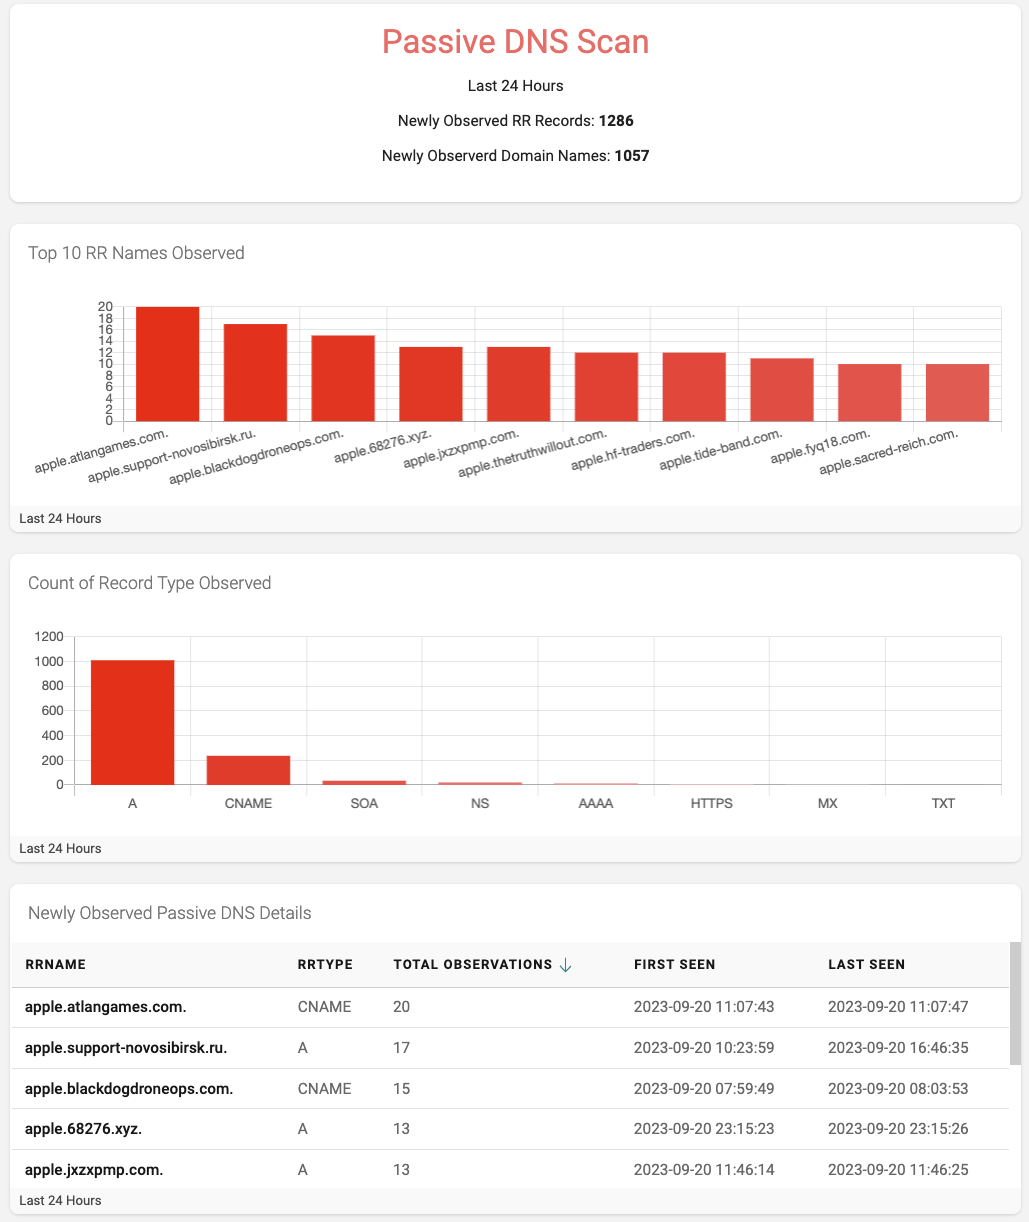
The dashboard shown in Figure 4 uses bar graphs to visualize the number of newly observed DNS resource records, domain names, and the top 10 most observed hostnames containing the brand in question for the past 24 hours. Finally, a table details the relevant attributes of each research record observed.
Setting Alerts
Another handy DAP feature is the ability to set alerts on dashboard elements to highlight data that might interest the user. Figure 5 below shows an example of a DAP alert configured to be displayed when the Threat Score exceeds the value of 50.
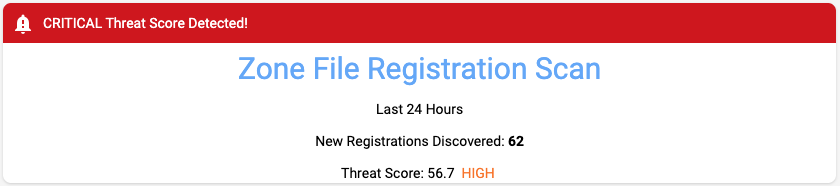
Configuring alerts such as this lets users quickly be aware of issues needing immediate attention. The DAP also has email-based notification capabilities. In a future blog post, we will describe the DAP notification capabilities in more detail.
Conclusion
Using the DAP’s native capabilities, we quickly and easily built a high-level dashboard to collect and visualize recent activity for a particular brand string across three important vectors: domain name registrations, blockchain registrations, and newly observed DNS queries.
To accomplish this, we used the following DAP analytical tools:
- Stored Queries: Used to search for strings in each data feed. (e.g., Find all rows where the domain name contains or is like a string.)
- Filters: Used to narrow down the results of a query. (e.g., only show activity detected in the past 24 hours.)
- Parameters: Used to configure stored queries and dashboards, allowing DAP users to indicate different values to be evaluated. In this example, the queries and the dashboards were configured to allow the details of one or more brand strings to be shown.
- Summarizations: Used to summarize results for visualizations. (e.g., Summarize the results by registrar.)
- Levenshtein Distance Algorithm: Used to find “similar” strings. (e.g., Return all strings similar to “brand” with a Levenshtein distance value of less than three.)
- Snapshots: Used to save a copy of a stored query at a particular point in time. Snapshots allow users to perform longitudinal analysis of data over time in addition to being a helpful way of making the results of stored queries that rely on real-time data load more quickly.
- Custom Formulas: Used to implement calculations and algorithms, such as a Threat Score, using data derived from one or more stored queries.
And the following DAP visualization capabilities:
- HTML Templates: Used to provide customized representations of data resulting from stored queries and snapshots.
- Bar Graphs, Doughnuts, and Pie Charts: Used to visualize data.
- Tables: Used to display the detailed results of a stored query or snapshot in a tabular form.
Finally, when specific criteria are met, we configured a visual indication using the DAP alerting functionality. (e.g., when the threat score is greater than 50).
Notes
The Zone files include data from all legacy and most new gTLDs and the following ccTLDs: UK, EE, SE, and NU.
For our example, we created a dashboard for a single example brand; however, defining a watch list of multiple strings and brands would be easy.
This dashboard only summarizes relevant data for an example brand. It does not include any workflow required to act upon the data presented. Determining which domain names returned might be malicious vs. which have been correctly registered is an exercise left to the reader.
It would be trivial to filter out registrations known to be “real” (or not a threat) based on a list of known/approved registrars or name server entries. Similar filtering can be done using the Registrant ID associated with Blockchain domain registrations.
Levenshtein Distance: https://en.wikipedia.org/wiki/Levenshtein_distance
In the dashboard, a threat score was defined for Domain Registrations. However, a custom threat score could also be developed for blockchain registrations and passive DNS activity.