China and India registered ASNs lead in malware distribution through IP addresses

By Alex Deacon
Summary
In this month’s Exploring DAP article, we delve beyond domain names into the world of IP addresses and their role in malware attacks. The findings show that while only 2.02% of reported phishing URLs directly use IP addresses, a significant 74.97% of reported malware URLs employ this method. Notably, a vast majority of IP addresses used in malware attacks are hosted on networks in the Asia-Pacific region, with China and India leading the pack. The complexity of investigating and mitigating internet abuse due to the involvement of various internet organizations and the international nature of these intermediaries point to the need for improved coordination, policy standards, and technical measures to enhance the efficiency and effectiveness of reporting and resolving internet abuse.
Exploring DAP...more than just domain names
To date, the Exploring DAP blog series has been primarily focused on topics related to domain names. In my August 14, 2023 blog “Use of Subdomain Providers Gains Popularity as a Mechanism to Launch Phishing Attacks,” we found that when it comes to malware attacks, most malware URLs avoid using domain names and use a raw IP address directly.
For this article, I will use the capabilities and data available in the DAP to analyze these IP addresses, including what part of the world and which specific networks host the malware infrastructure.
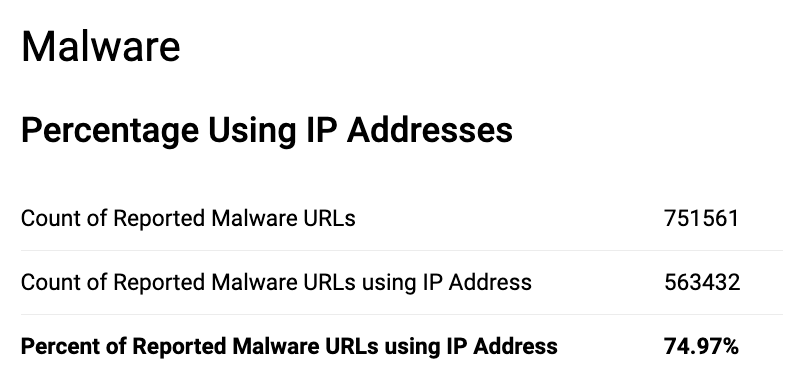
As a reminder, we analyzed 18 months of data (January 1, 2022, to June 30, 2023) from two of the DAP’s abuse feeds: DAP Phishing Combined, which contains phishing URLs reported to both OpenPhish and APWG and URLhaus: Complete Data Set, which includes malware URLs reported to the abuse.ch URLhaus Project. For Phishing URLs, we found that only 2.02% used IP addresses directly (vs. domain names). In contrast, the percentage of Malware URLs using IP addresses directly was 74.97% (Figure 1)
Figure 1 - Percentage of Malware URLs using IP Address
Typically, internet users are lured into downloading malware via spam and phishing attack vectors, which leverage domain names using well-known brands and other social engineering terms. Once this happens, using IP addresses to launch the malware attack is sufficient, as there is no longer a need for user-readable (or visible) identifiers such as domain names.
Looking at Trends
The calculations shown in Figure 1 above were done over the dataset as a whole. What trends could we discover in the data over time? To do this, I calculated each month's reported malware URL count. (Figure 2)
To see the full dashboard click here
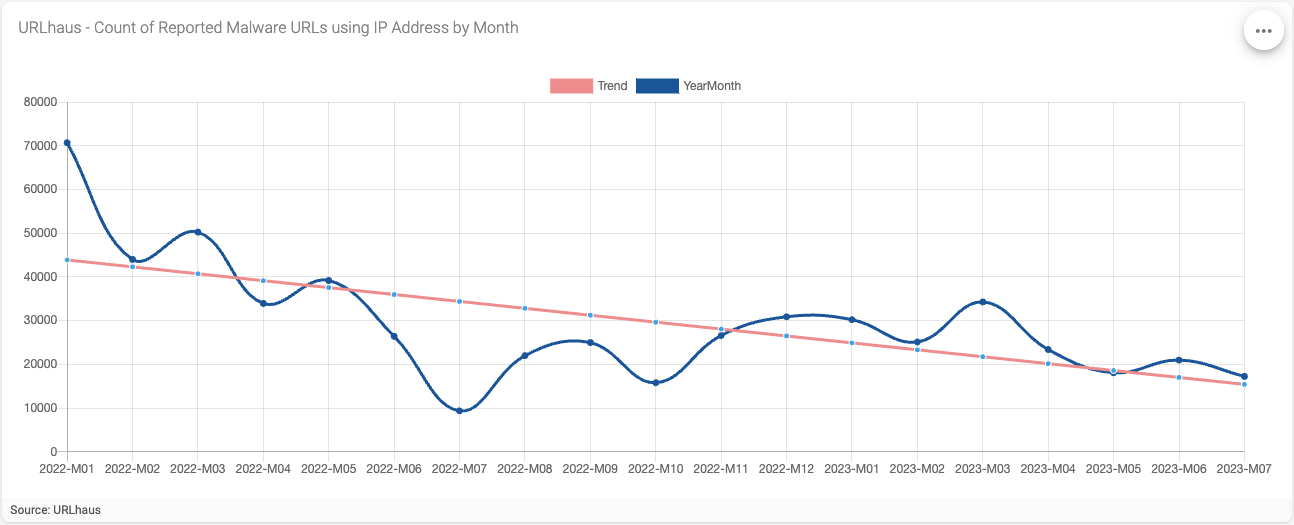
Figure 2 - Count of Reported Malware URLs using IP Address by Month
The visualization in Figure 2 shows a downward trend of reported malware URLs for the period studied. In January 2022, we saw a high of just over 70,000 malware URLs reported. By July 2023, however, the number of reported malware URLs ended up close to 17,000.
Next, I wanted to see how the percentage of malware URLs using IP addresses only, trended by month for the same period.
To see the full dashboard click here
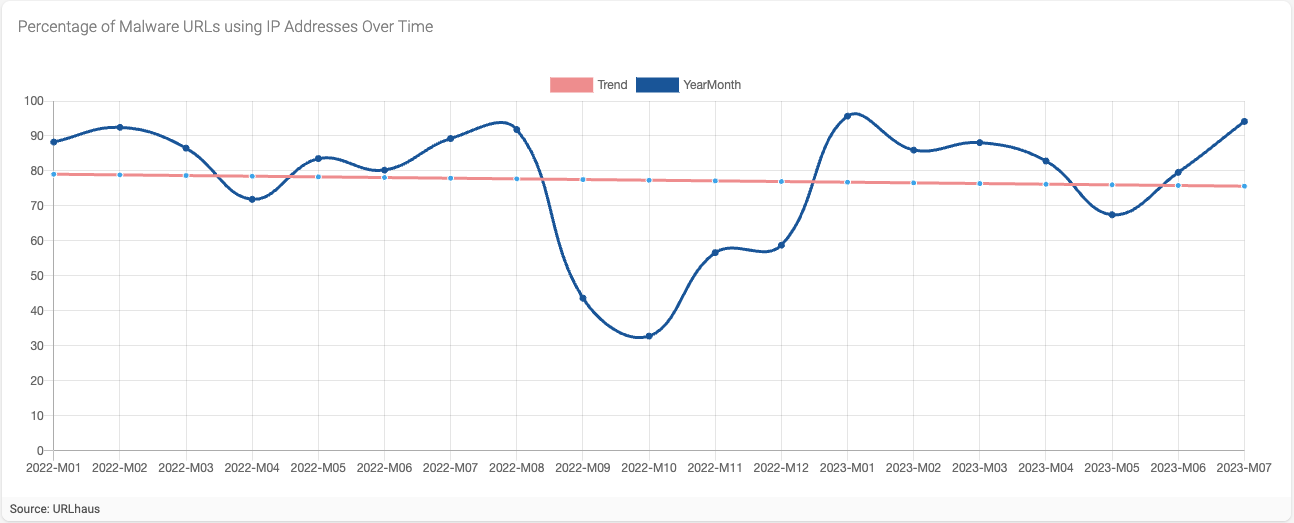
Figure 3 - Percentage of Malware URLs using IP Addresses Over Time
Autonomous System Analysis
The internet is a network of networks. Autonomous Systems (AS) represent a collection of one or more networks with a defined routing policy. These routing policies allow data to be delivered (or “routed”) from one network to another. Data travels from AS to AS until it reaches its intended destination. Each AS is identified by a unique identifier called an Autonomous System Number (ASN). Five (5) Regional Internet Registries (RIRs), each representing a specific region, are responsible for assigning AS Numbers to ISPs and other organizations.
AFRINIC - Africa
APNIC - Asia and Oceania
ARIN - United States, Canada, many Caribbean, and North Atlantic islands
LACNIC - Mexico, South America and Caribbean
RIPE NCC - Europe, Middle East and Central Asia
Using BGP routing data from RouteViews, we can map IP addresses to their current origin ASN. By correlating this data to data obtained from the RIRs we are able to discover which RIR has assigned a given IP address along with the country where it is located and which organization manages the ASN.
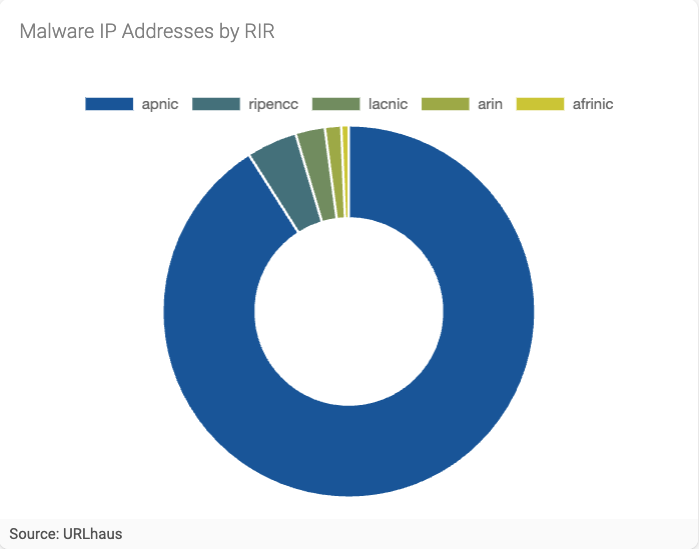
Figure 4 - Malware IP addresses by RIR
We find that a vast majority of IP addresses used in malware attacks, 90.1%, have been registered by APNIC to organizations in the Asia Pacific region. Followed by RIPE NCC at 4.4%, LACNIC at 2.6%, ARIN at 1.4%, and AFRINIC at 0.7%. (Figure 4)
If we look at the country associated with each IP address, we better understand the specific countries associated with IP addresses used for malware abuse across all RIRs.
To see the full dashboard click here
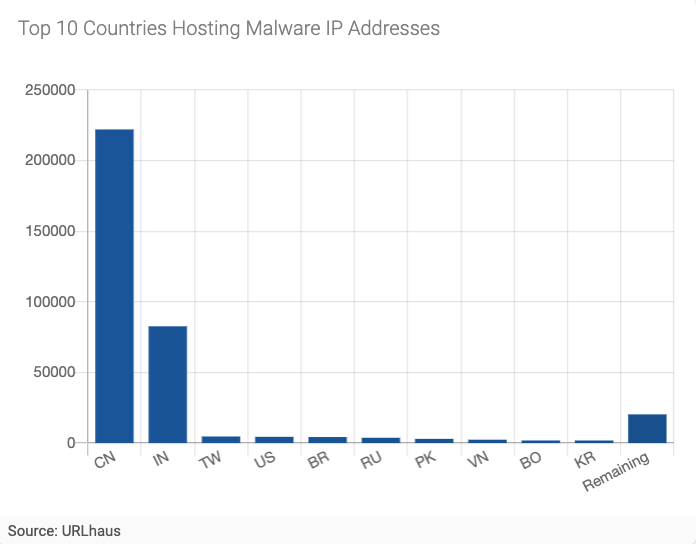
Figure 5 - Top 10 Countries Hosting Malware IP Addresses
In Figure 5, we can see that the country associated with the most malware IP addresses is China, with 222,072 IP addresses. India follows with 82,685 IP addresses. After China and India, there is quite a “long tail” of countries, including Taiwan, the United States, Brazil, Russia, Pakistan, Vietnam, Bolivia, and Korea. China and India account for 63% and 23% of all malware IP addresses reported for the period, respectively.
AS Number and Name
We can better understand where the IP addresses are hosted by looking at the AS Number and the associated AS Name. Each RIR is responsible for maintaining a directory of AS registrants (via a WHOIS service), which allows us to discover the network hosting the IP address, be it an ISP, large regional network, or hosting service provider (among others). Importantly, the WHOIS information associated with the AS Number includes abuse points of contact for the network operator. Access to this registration information is crucial for abuse reporting and mitigation efforts.
To see the full dashboard click here
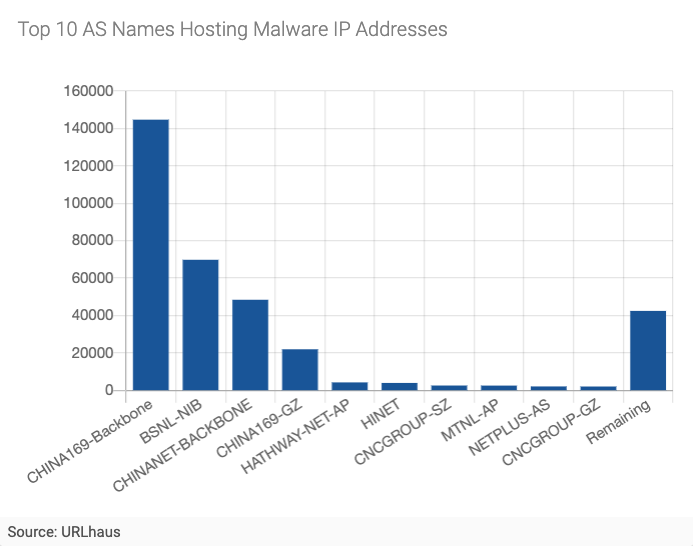
Figure 6 - Top 10 AS Names Hosting Malware IP Addresses
All of the Top 10 AS Names shown in Figure 6 have been registered to organizations in the Asia Pacific region.
Conclusions
The DAP hosts a wealth of data on IP addresses and Asynchronous Systems obtained from Regional Internet Registries and $BGP routing information sources. This data, along with data associated with Domain Names and DNS queries, enables users to get a 360-degree view of internet activity they may need to investigate and understand.
Investigating and reporting internet abuse is challenging and complicated, given the numerous internet organizations involved. Hosting and network infrastructure providers, such as those we highlighted in this blog, play a key role in mitigating abuse, along with domain name registries, registrars, and subdomain providers, and others. To further complicate things, the data obtained in our analysis highlights the many challenges caused by the international nature of the intermediaries used by criminals and scammers to abuse internet users. Complexities caused by issues related to multi-jurisdictional characteristics of operators and the laws they operate under can hinder the investigation, mitigation, and resolution of abuse targeted to internet users.
As discussed in previous blogs, governance gaps regarding the proper way to report abuse and the lack of coordination between internet intermediaries unnecessarily complicate abuse mitigation efforts. In addition, given the multiple mechanisms to report abuse across the various intermediaries, there is an obvious need for policy and technical standards to make reporting and resolving internet abuse more efficient and effective.
Join the discussion
#MalwareDistribution #IPAddresses #Cybersecurity

