New Project
Create a new project by selecting 'Select Project' and '+ New Project'.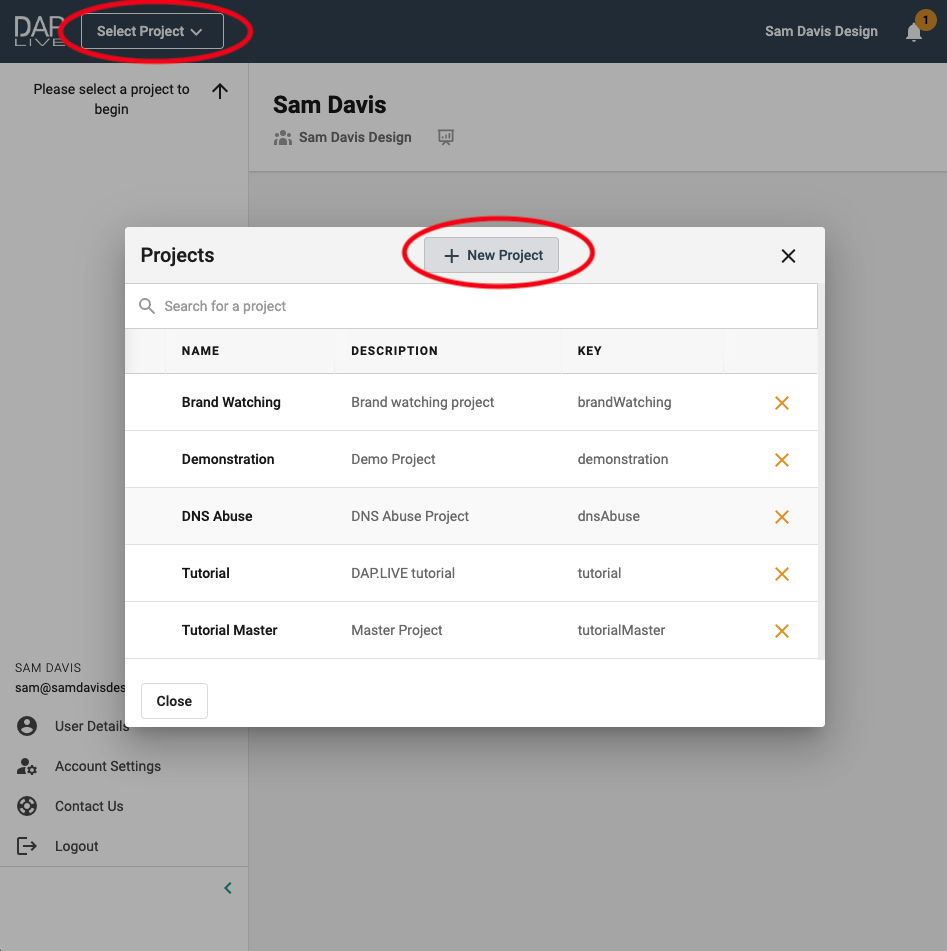
Give your project a title and description, then click 'Create Project'.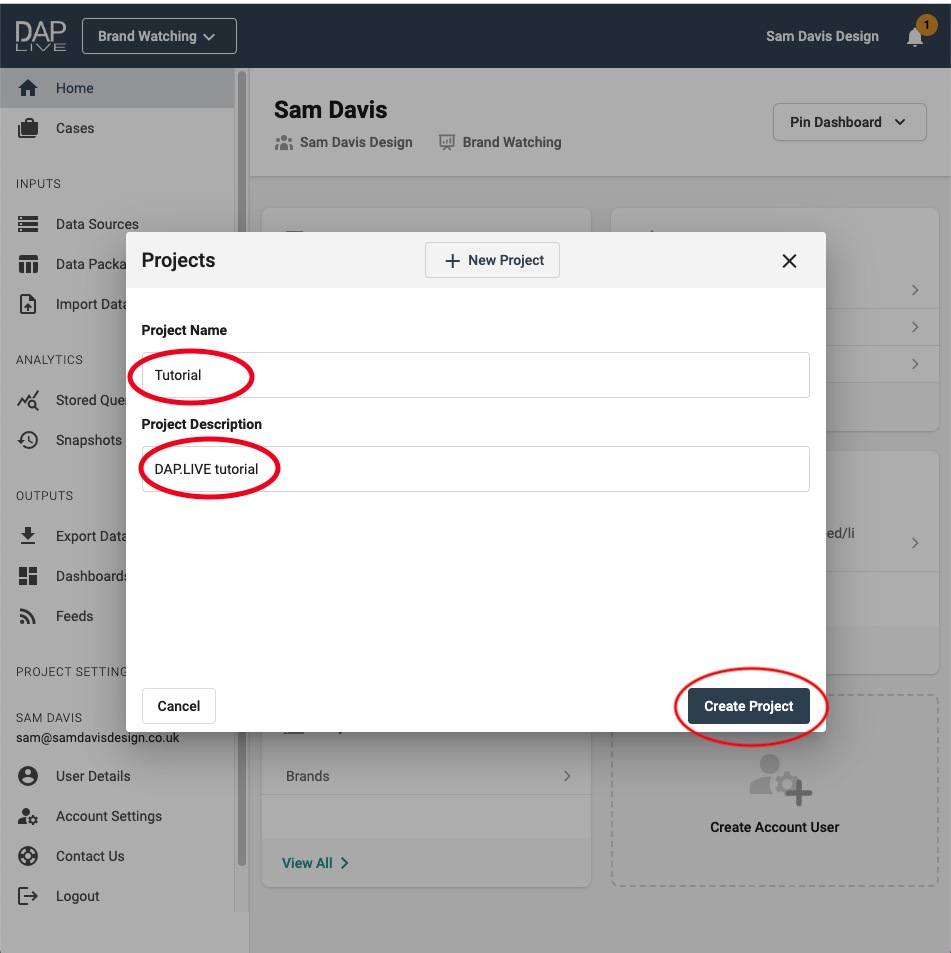
Data Packages
Once in your project, select 'DAP Data Feeds' (1), on the left-hand column, to access the data available to your account. Here you can search for specific data feeds (2) and create queries from each data feed (3).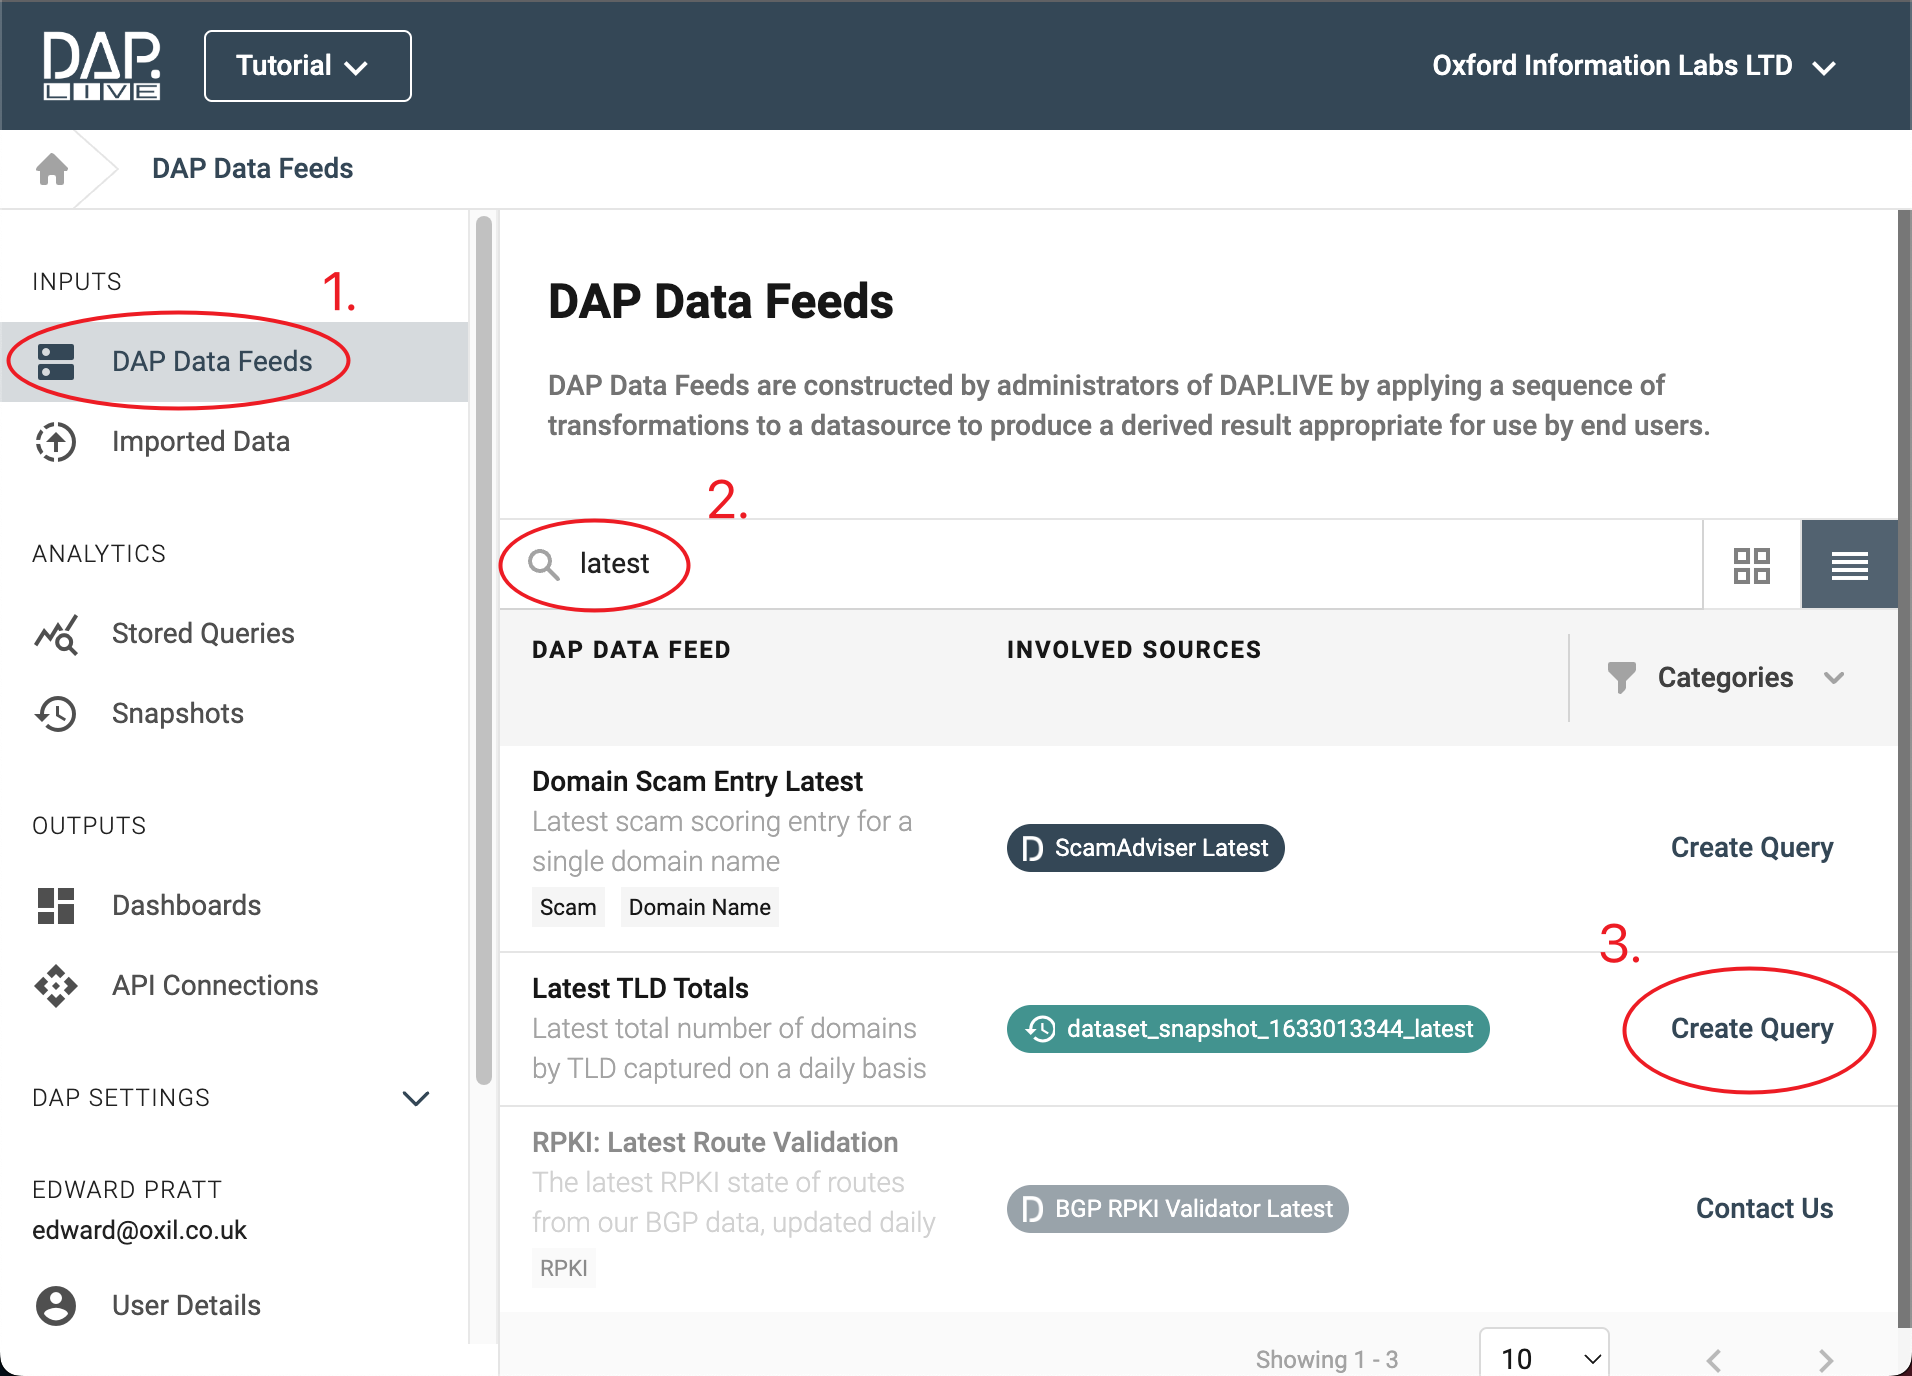
In this tutorial, the Latest TLD Totals data feed will be used as an example of how to query. To begin the analytics on this data, we will add a filter.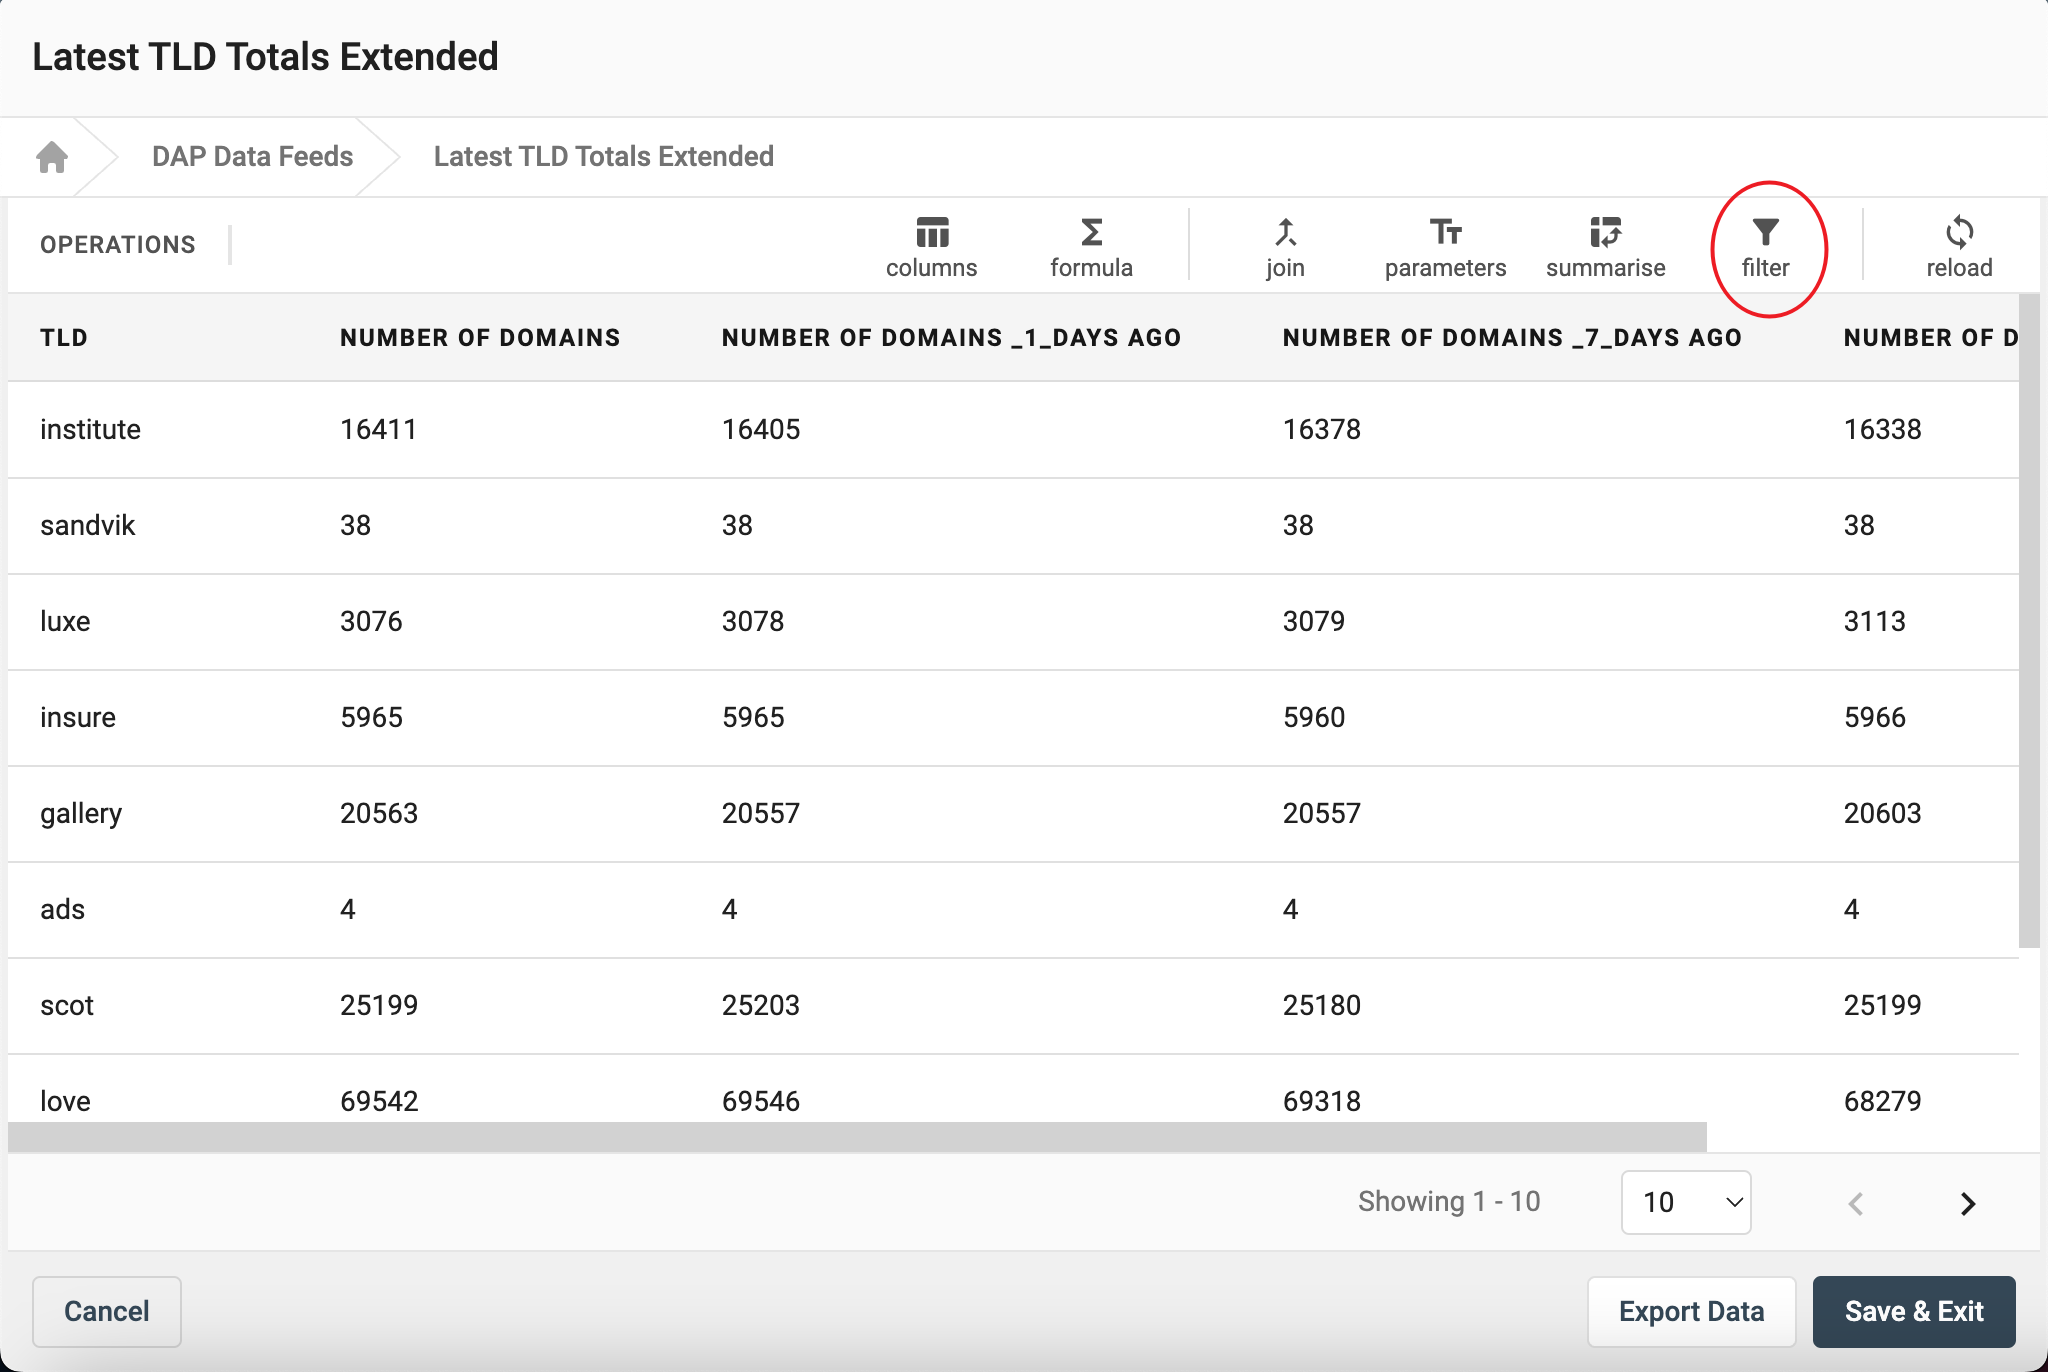
In this example, we will add a filter to remove any data without a TLD. You can do this by selecting 'TLD' - 'Not Equal To' - '', in the relevant boxes.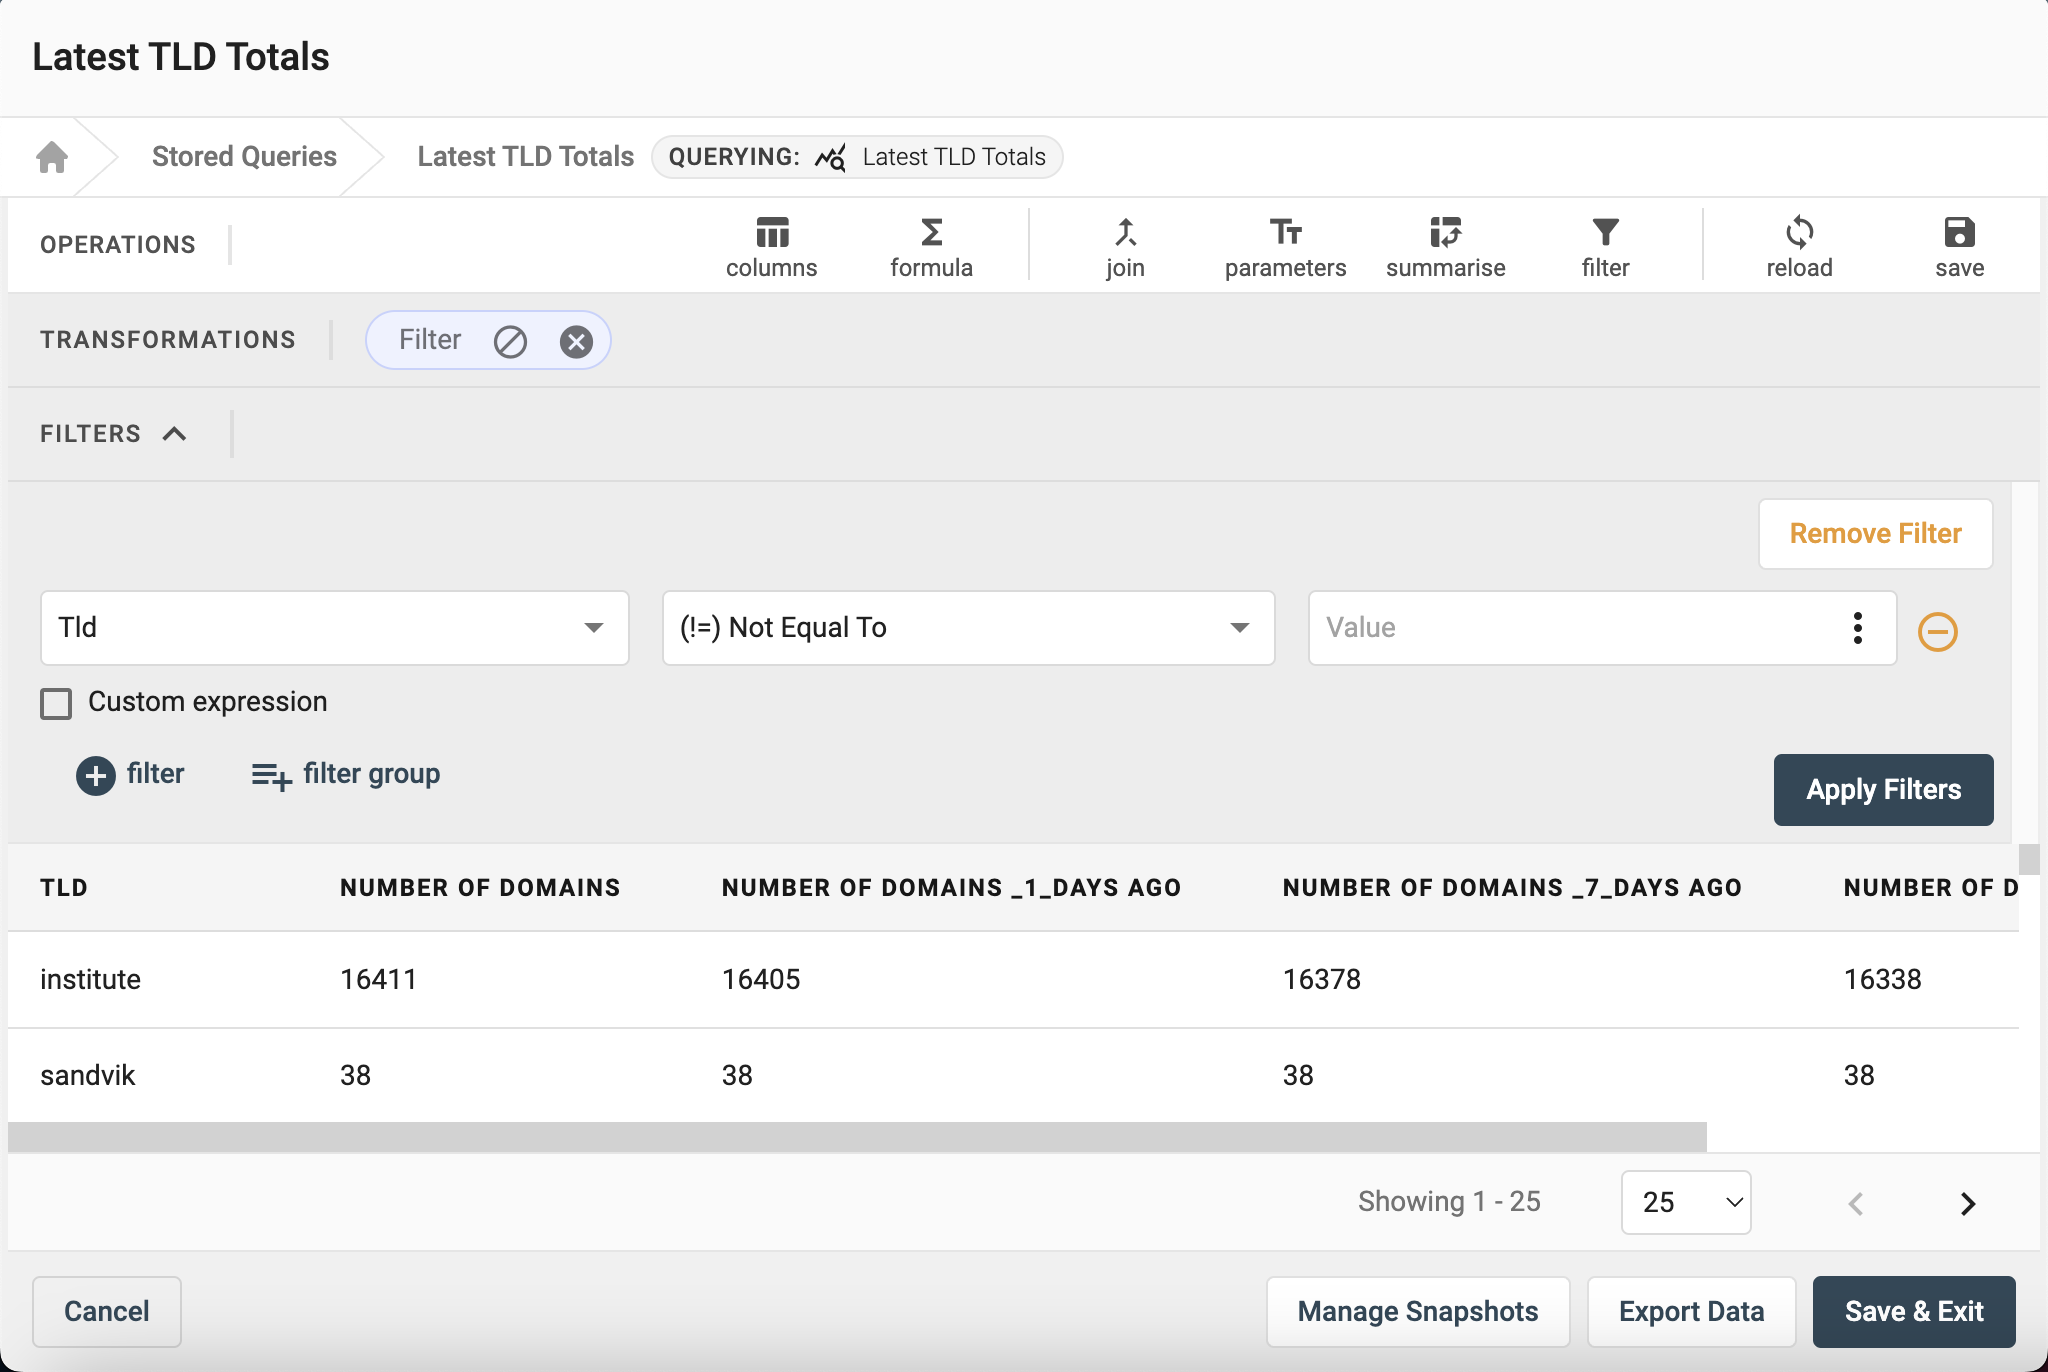
Now that all TLD column is full you can add a formula to determine the length of each TLD. This will allow you to find the longest TLD.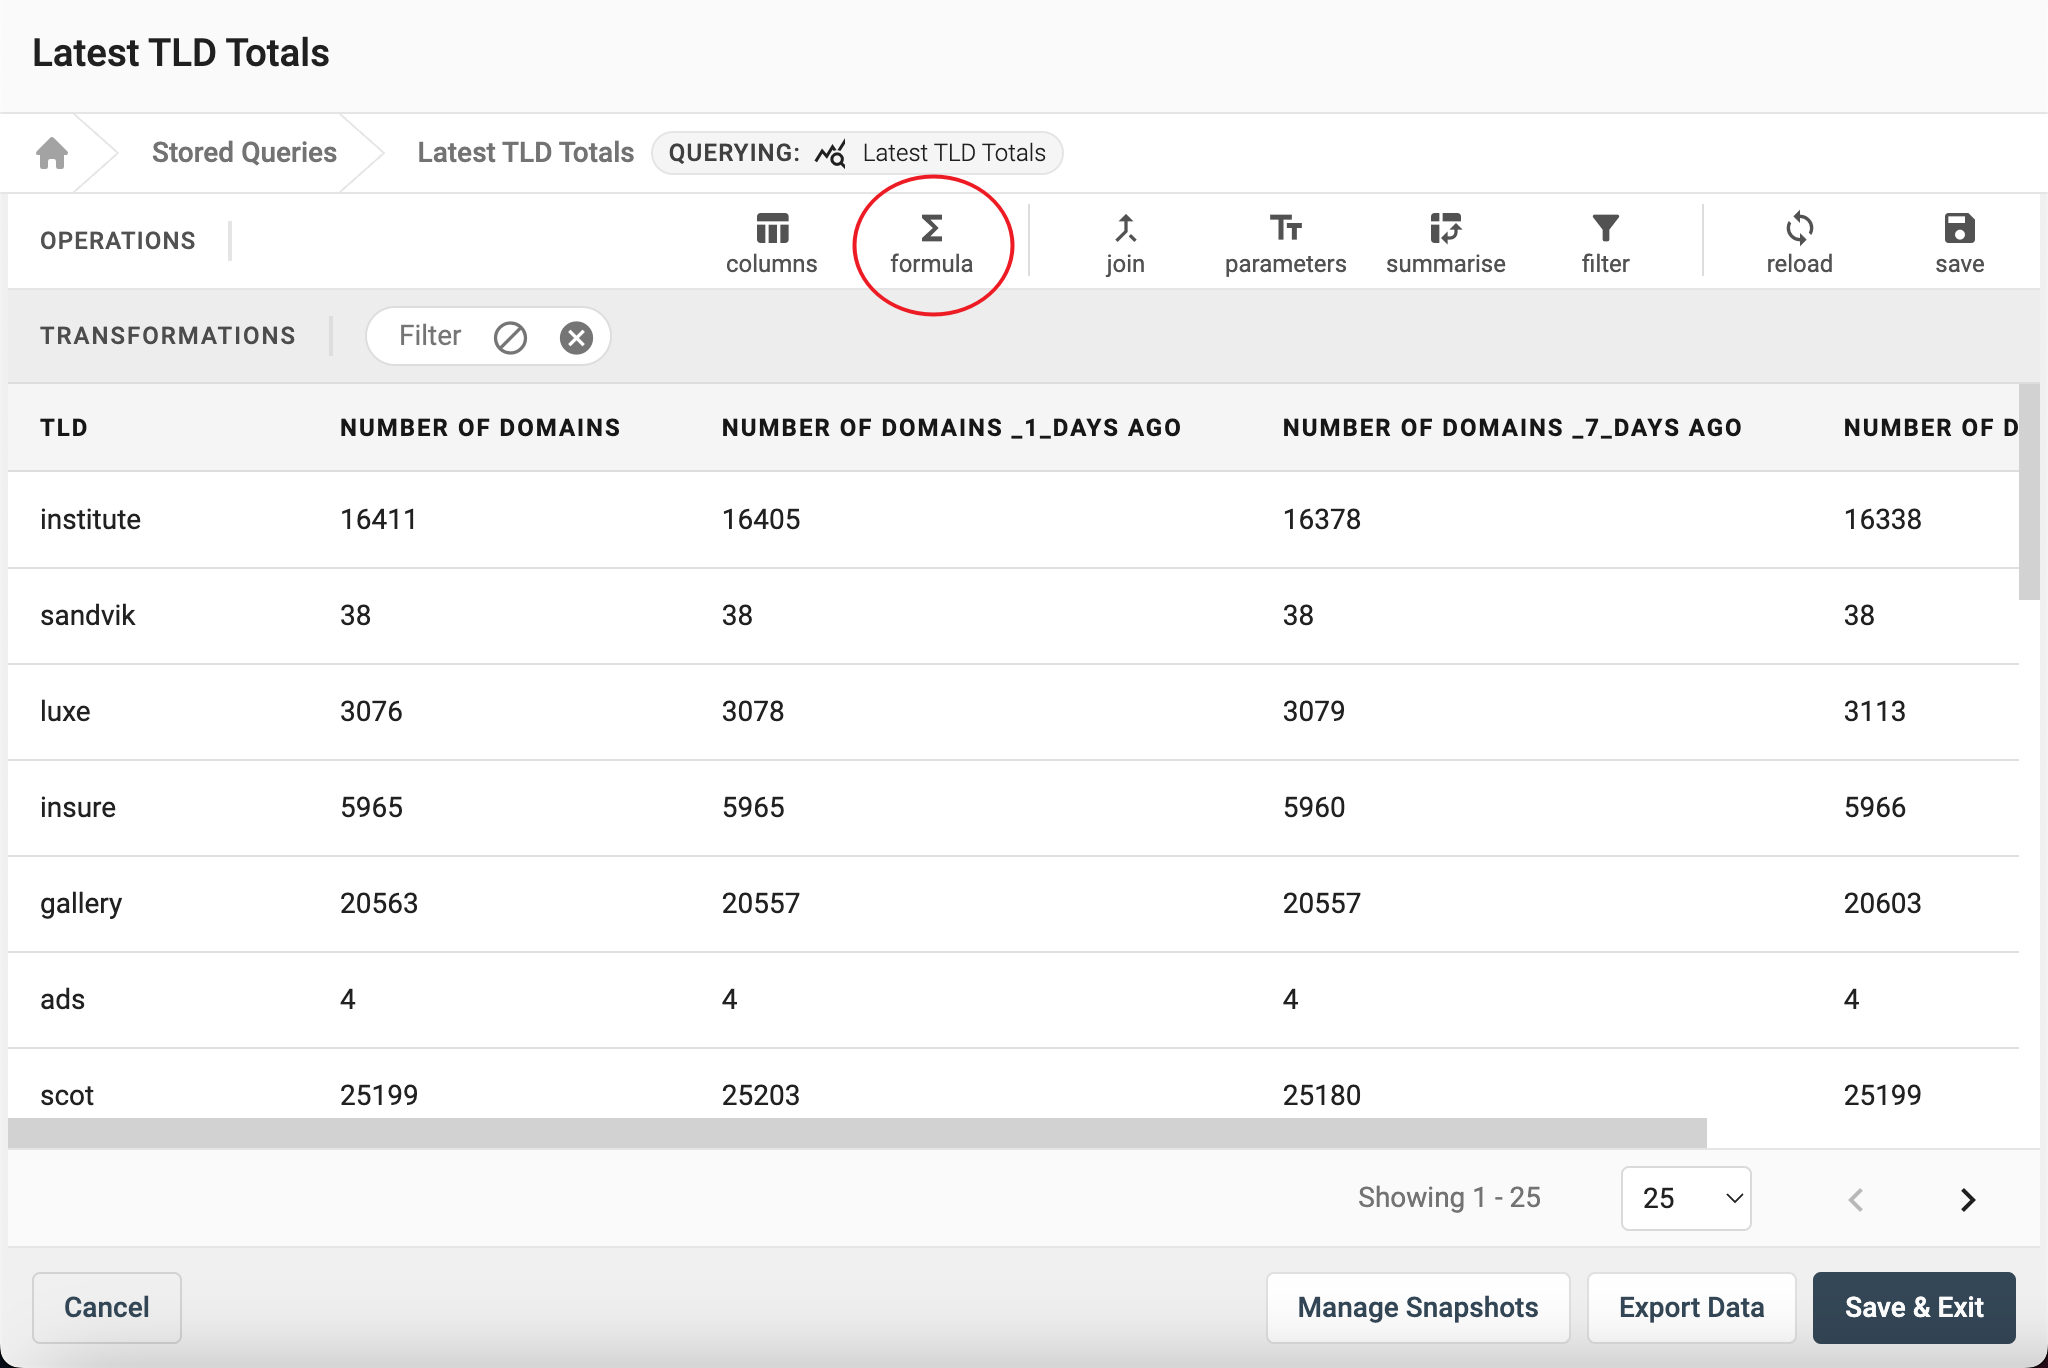
Here you can write your own formula to create a new column within your data. All available function are accessible below the expression box. You can also find additional documentation on writing formula's HERE.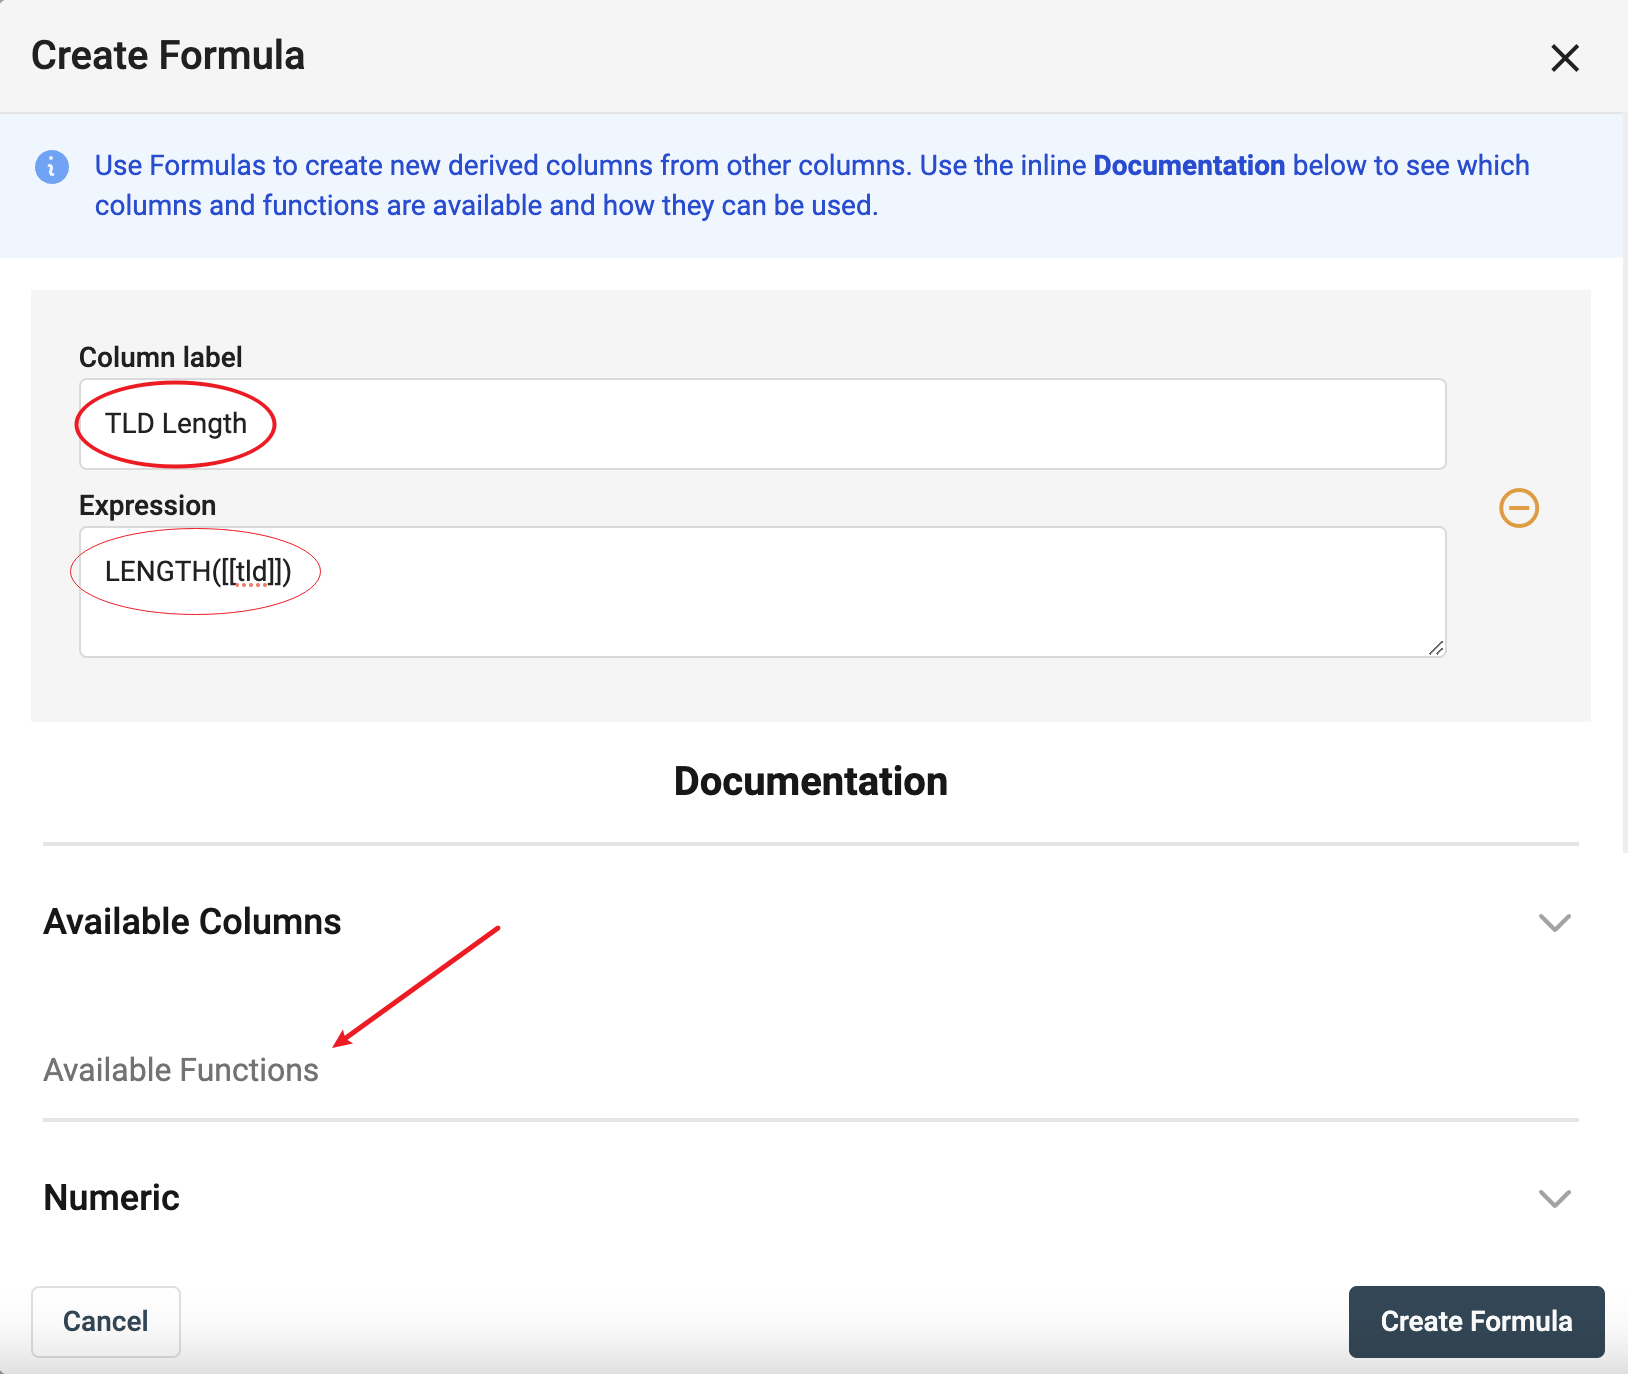
Once the formula is created you can sort the column in descending order by clicking the arrow next to the column title. This will allow you to see the longest TLDs first.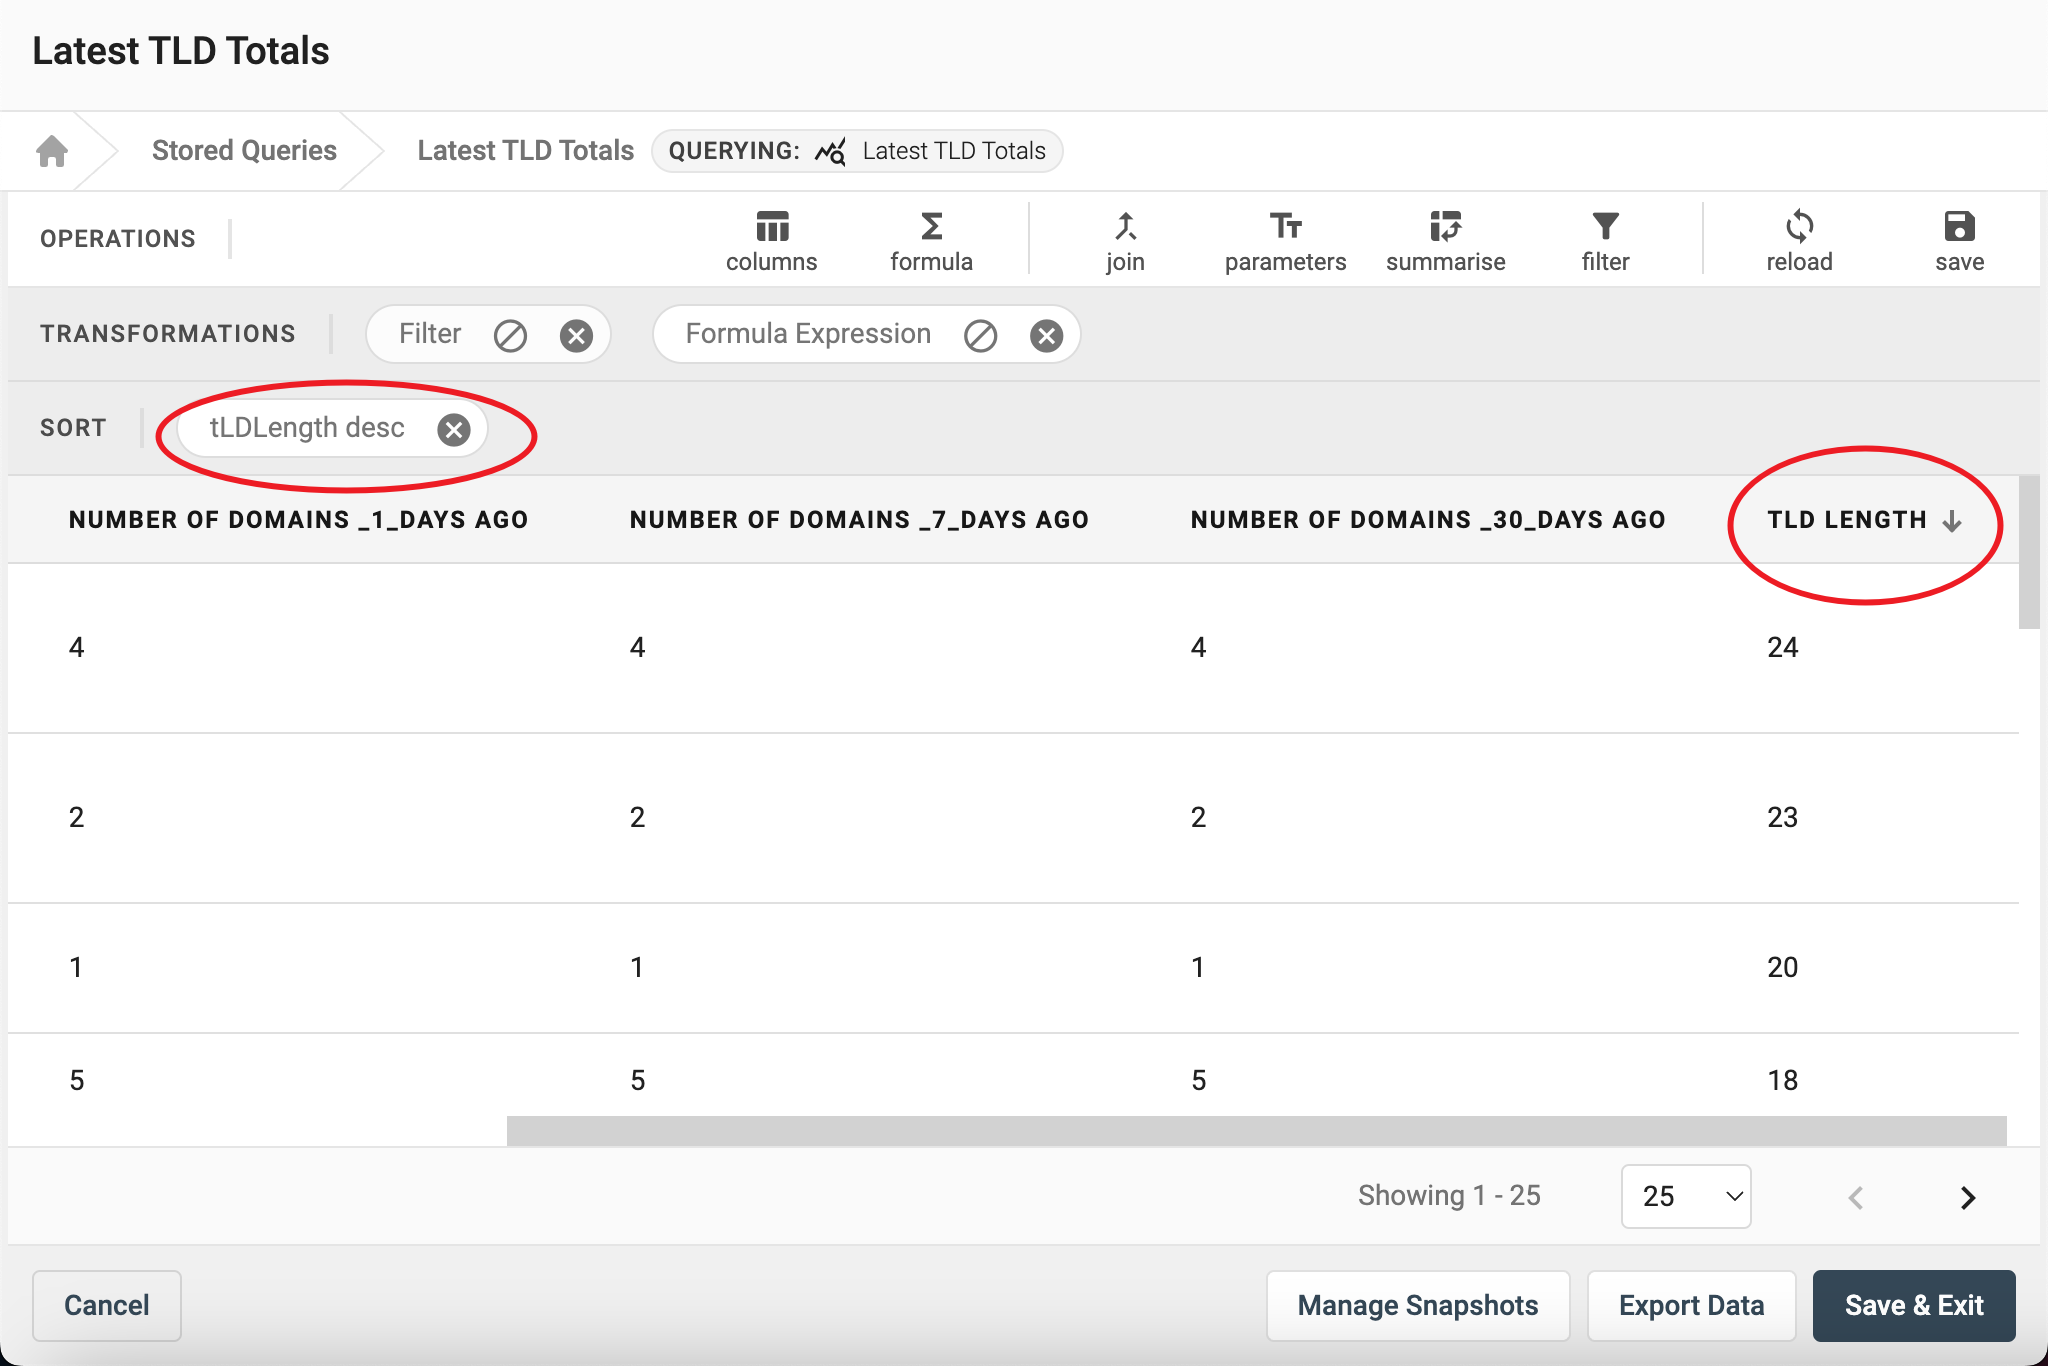
Extended Query
Now save the query and give it a name. - this will now be visible in the 'Stored Queries' section of the DAP. Here you can extend the query to perform further analysis. Begin this process by clicking the three dots on the right-hand side and selecting "Create Extended Query"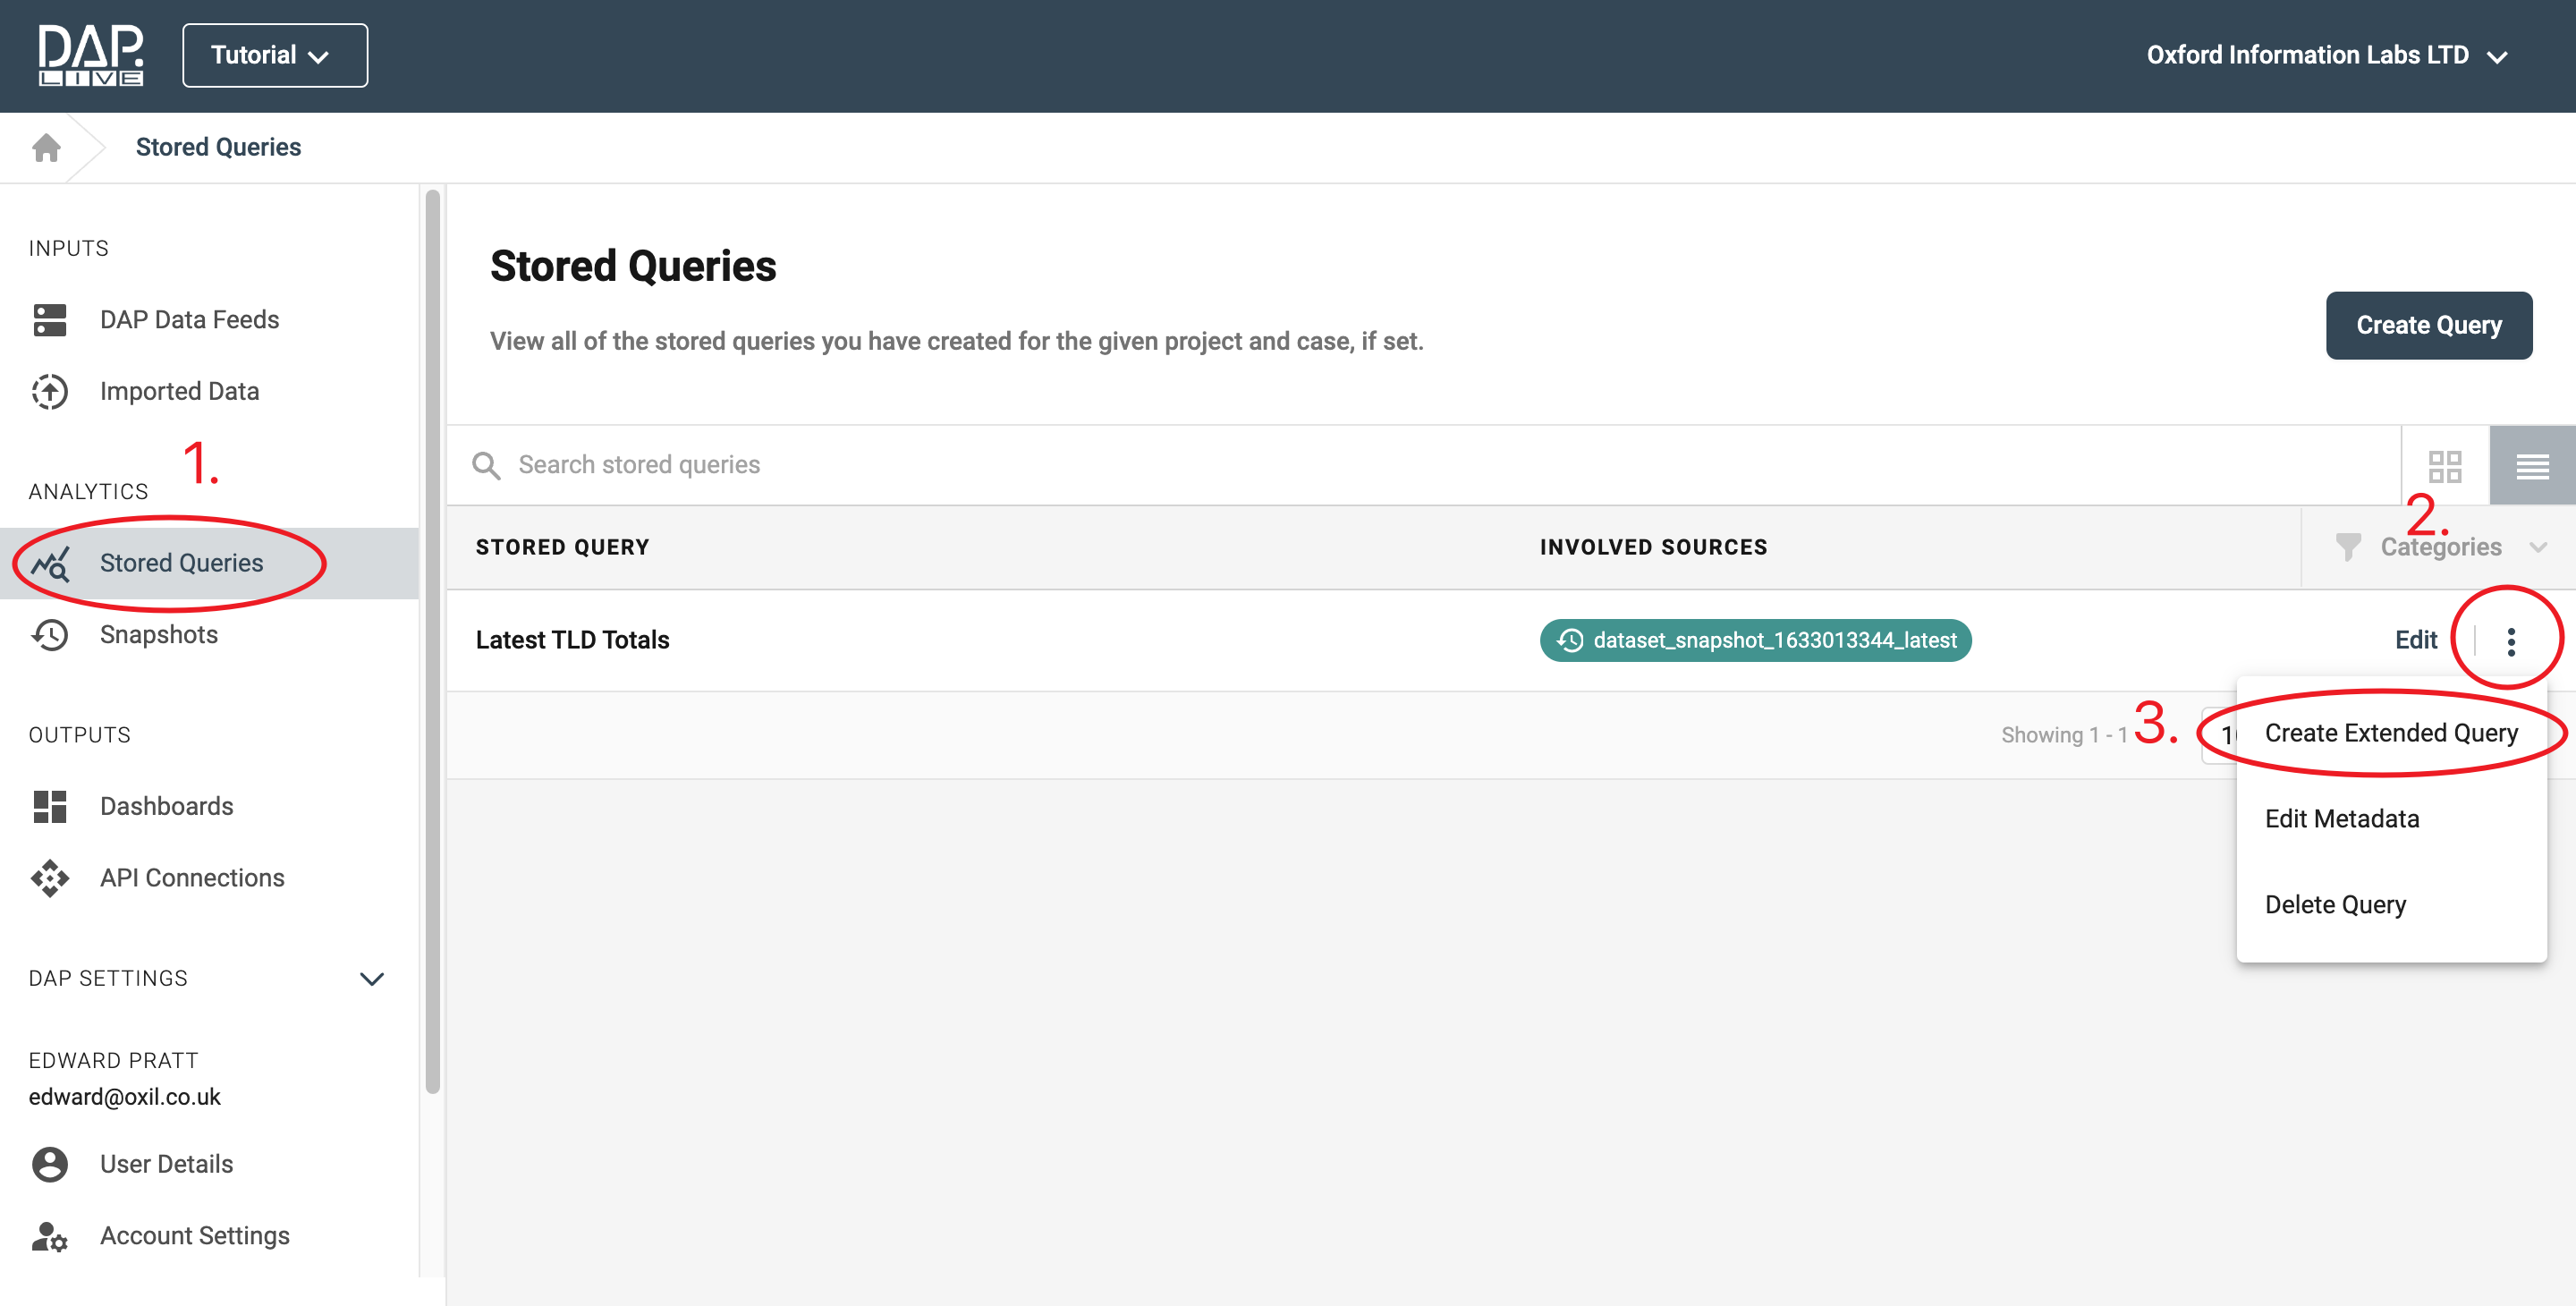
In this example we will extend the query and join it to two separate data packages to create one data set.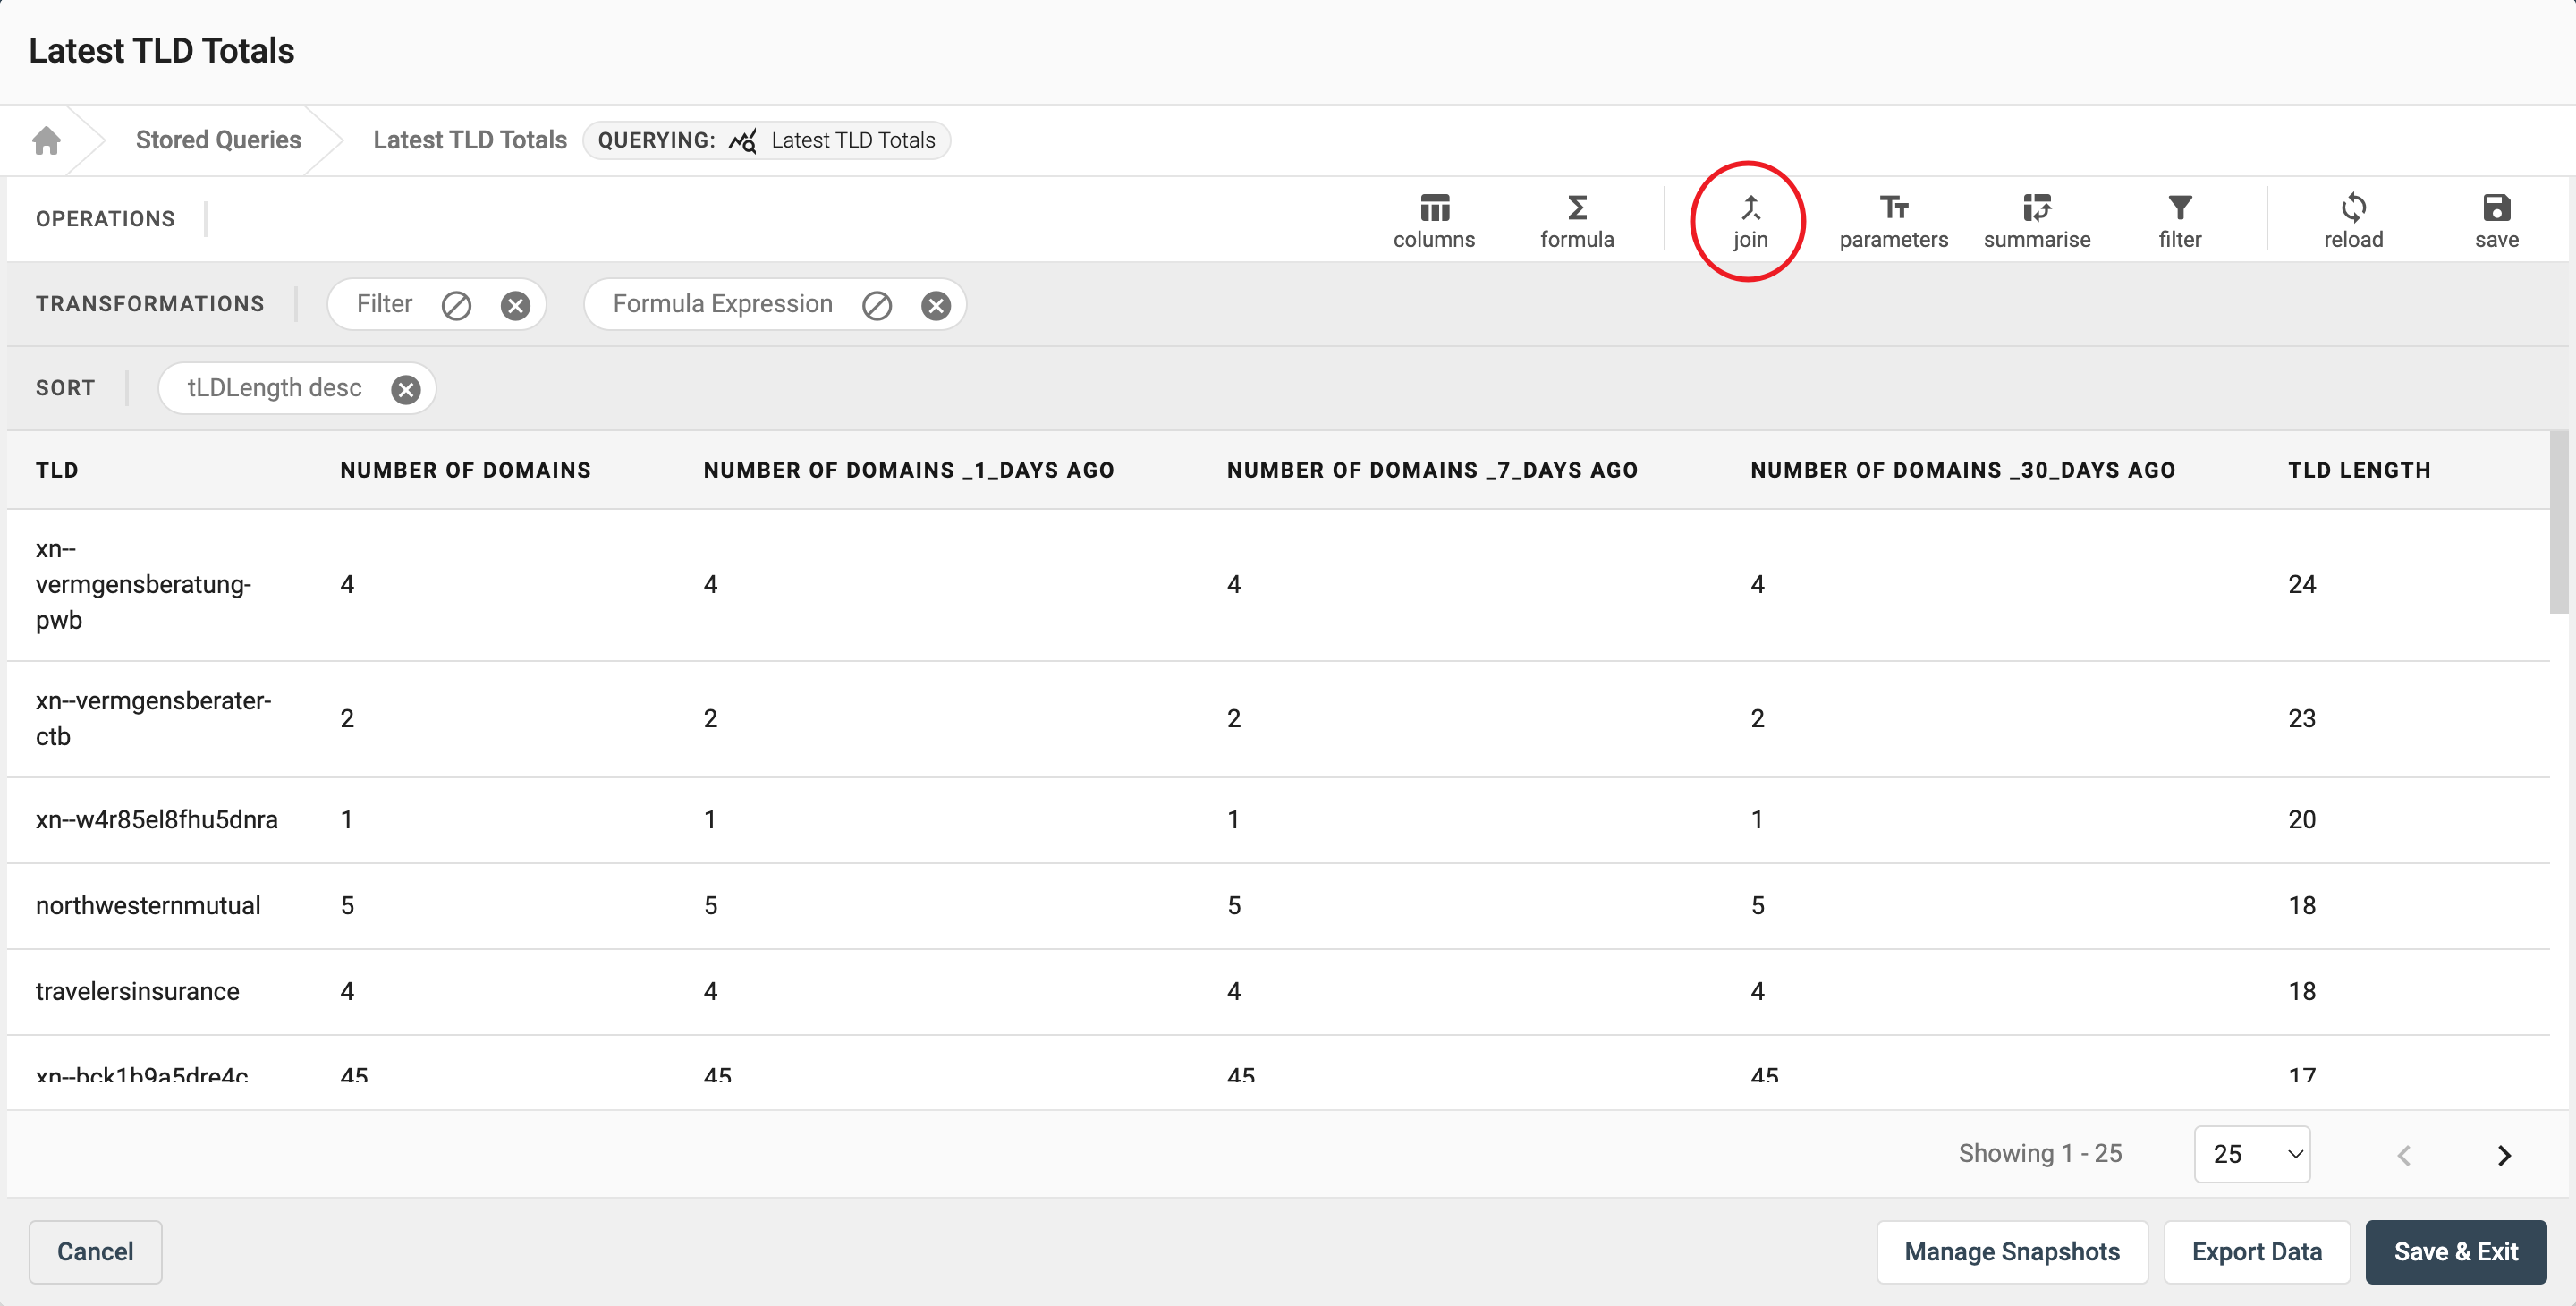
Search for which data package you would like to join with and click 'Select'.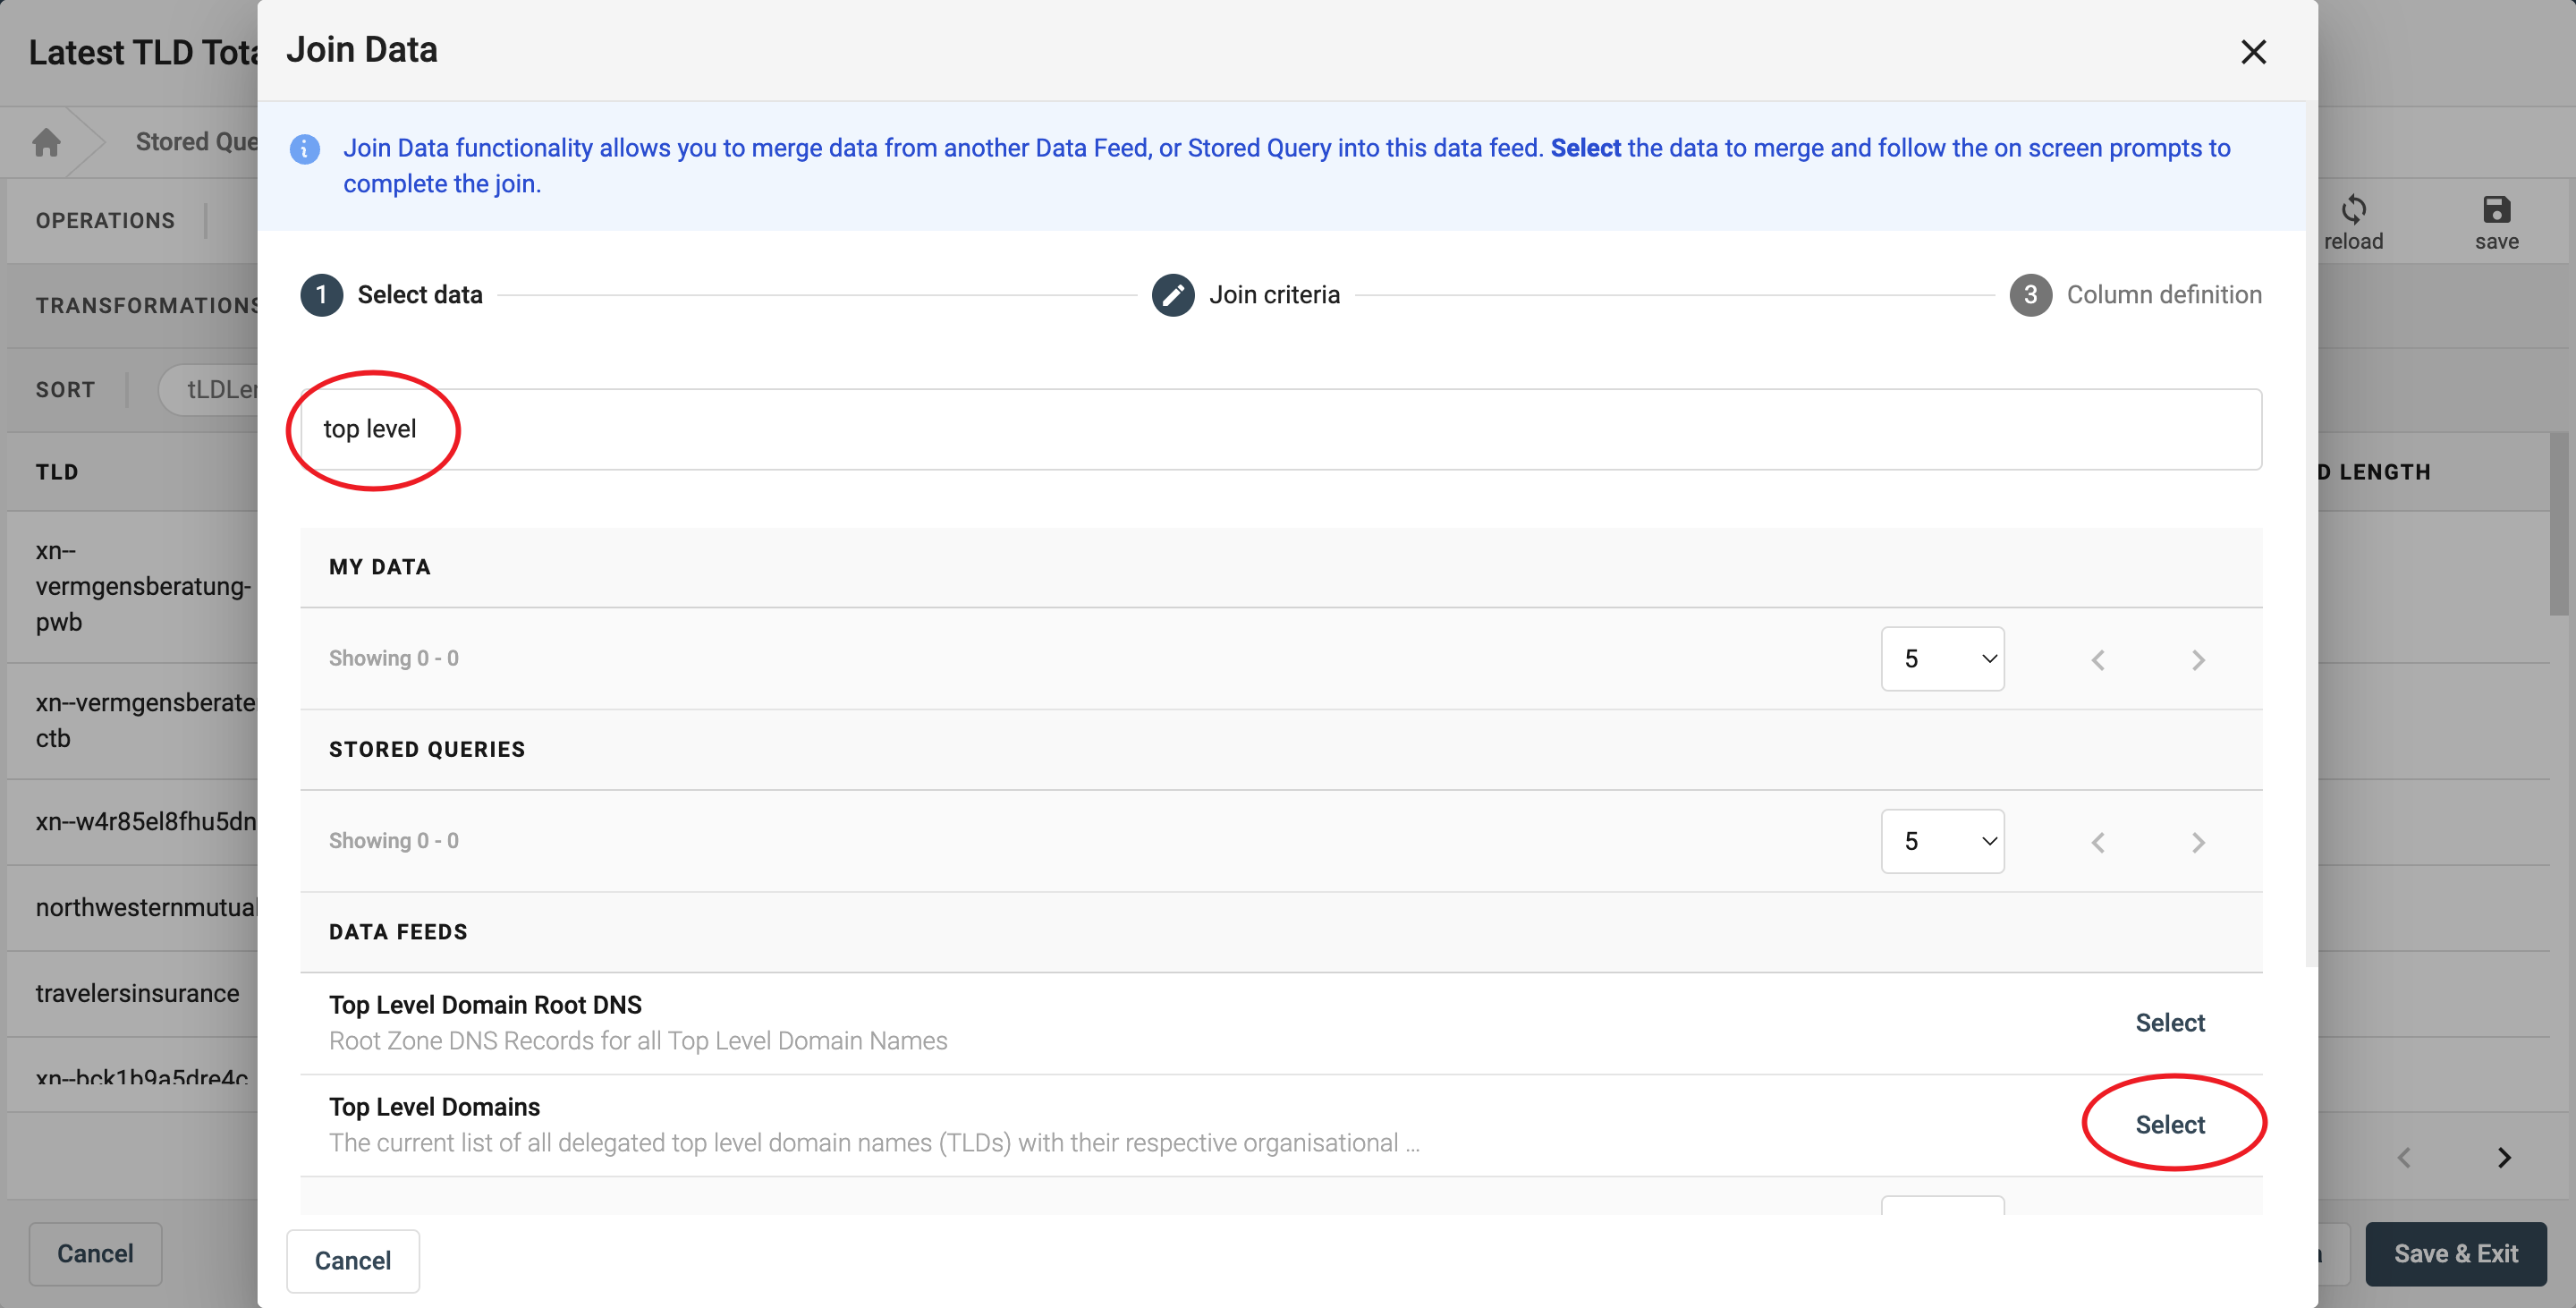
Then select which parameters the data should be mapped to. This will help the DAP to find which column of data to use when joining the packages. In this example, we have joined our query with 'Top Level Domains' on the TLD Column.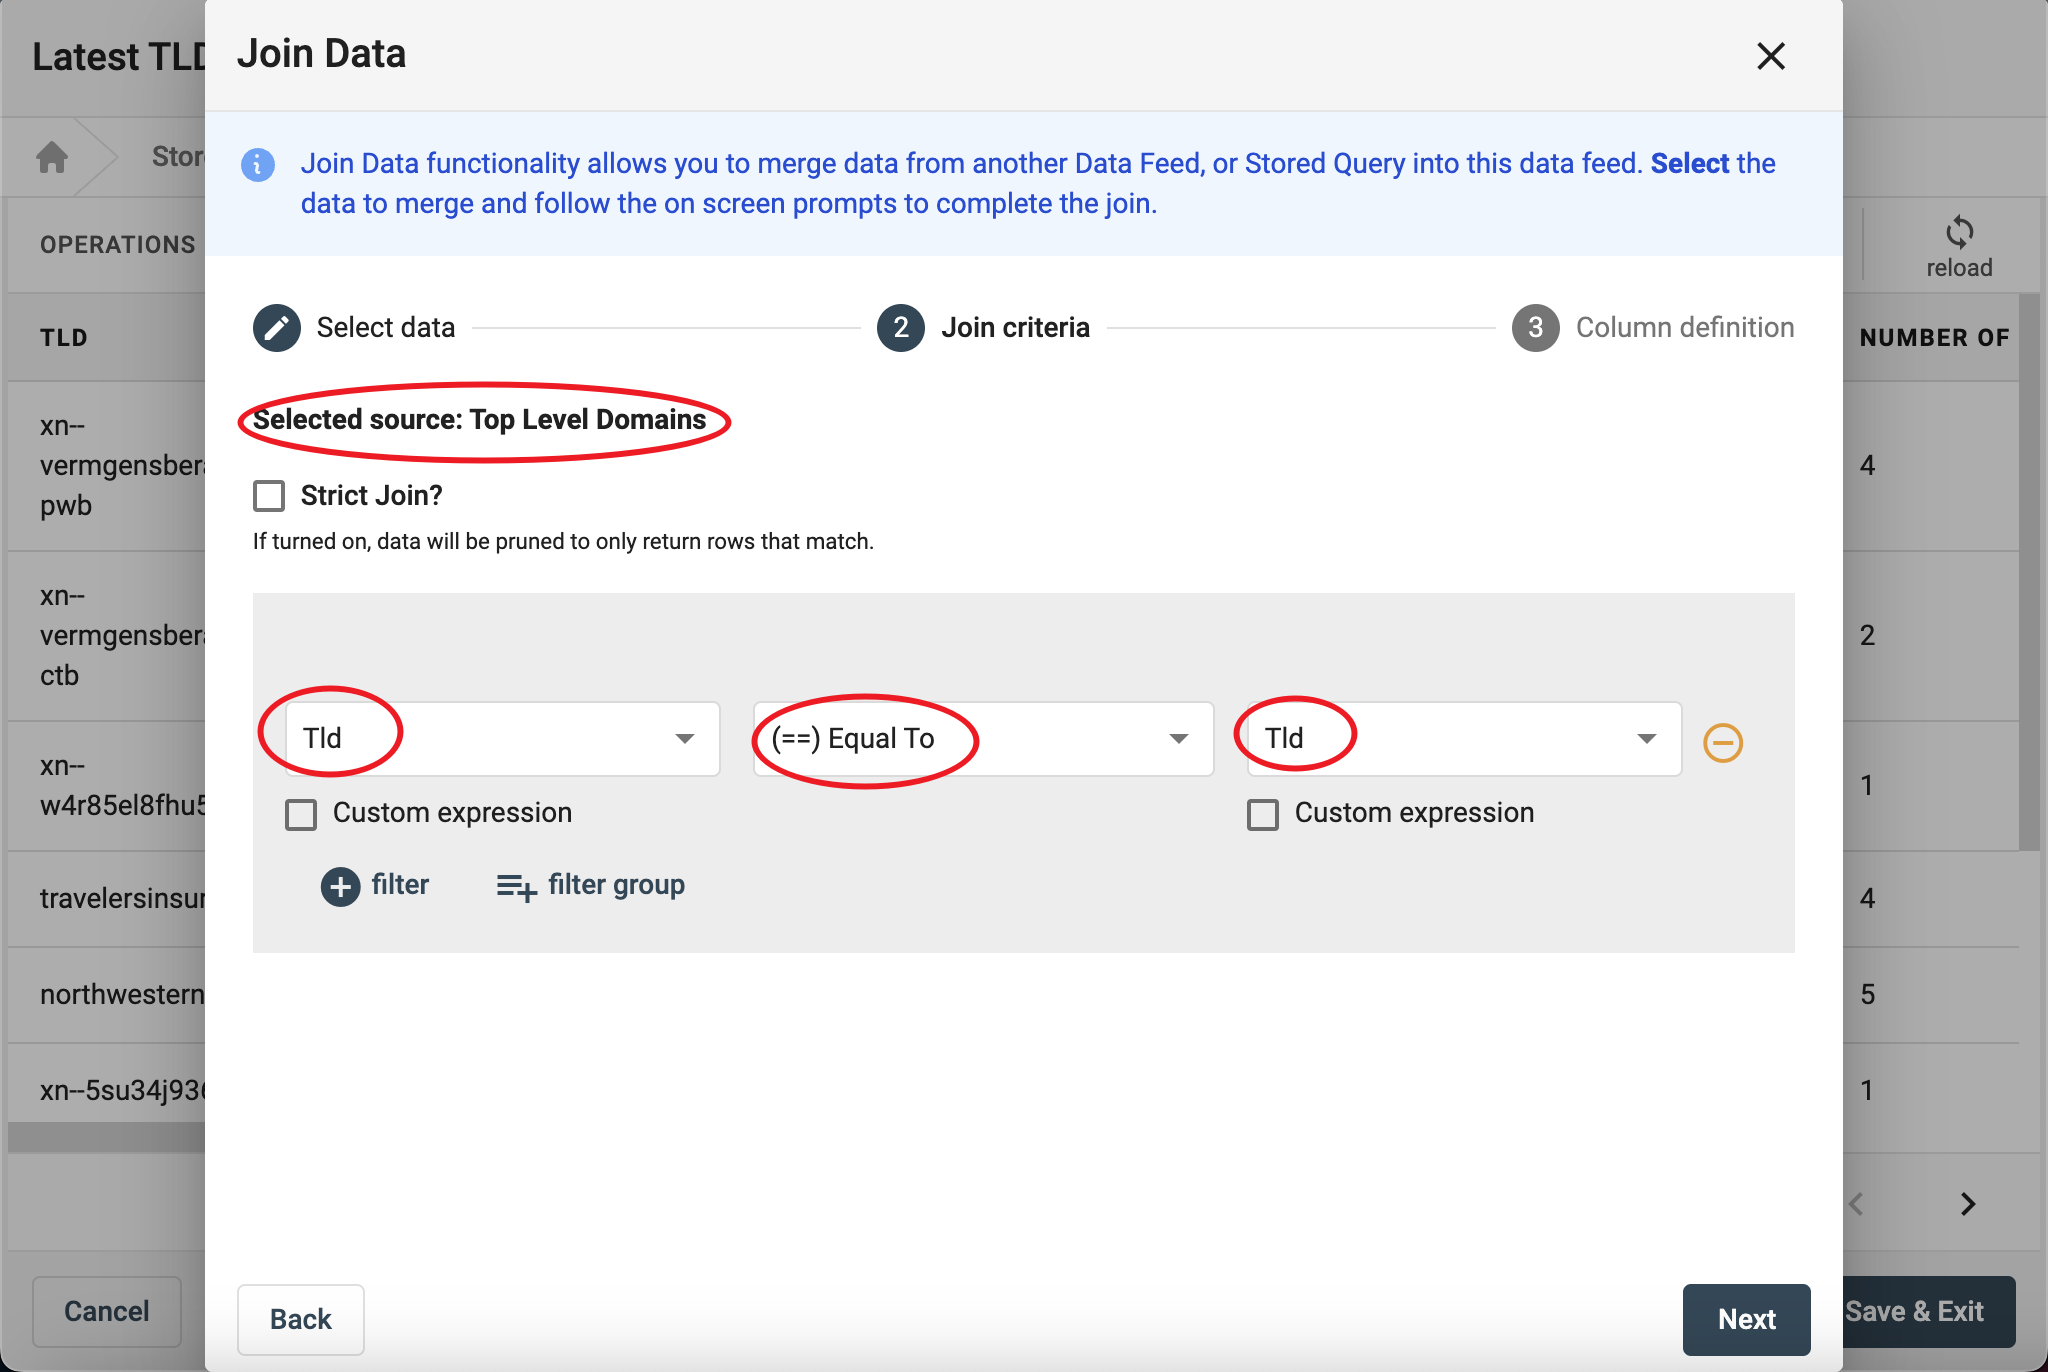
Now that the data feeds have joined, there may be data which you are not interested in. In order to minimise the noise within the data, you can edit which columns to include. First click the columns button.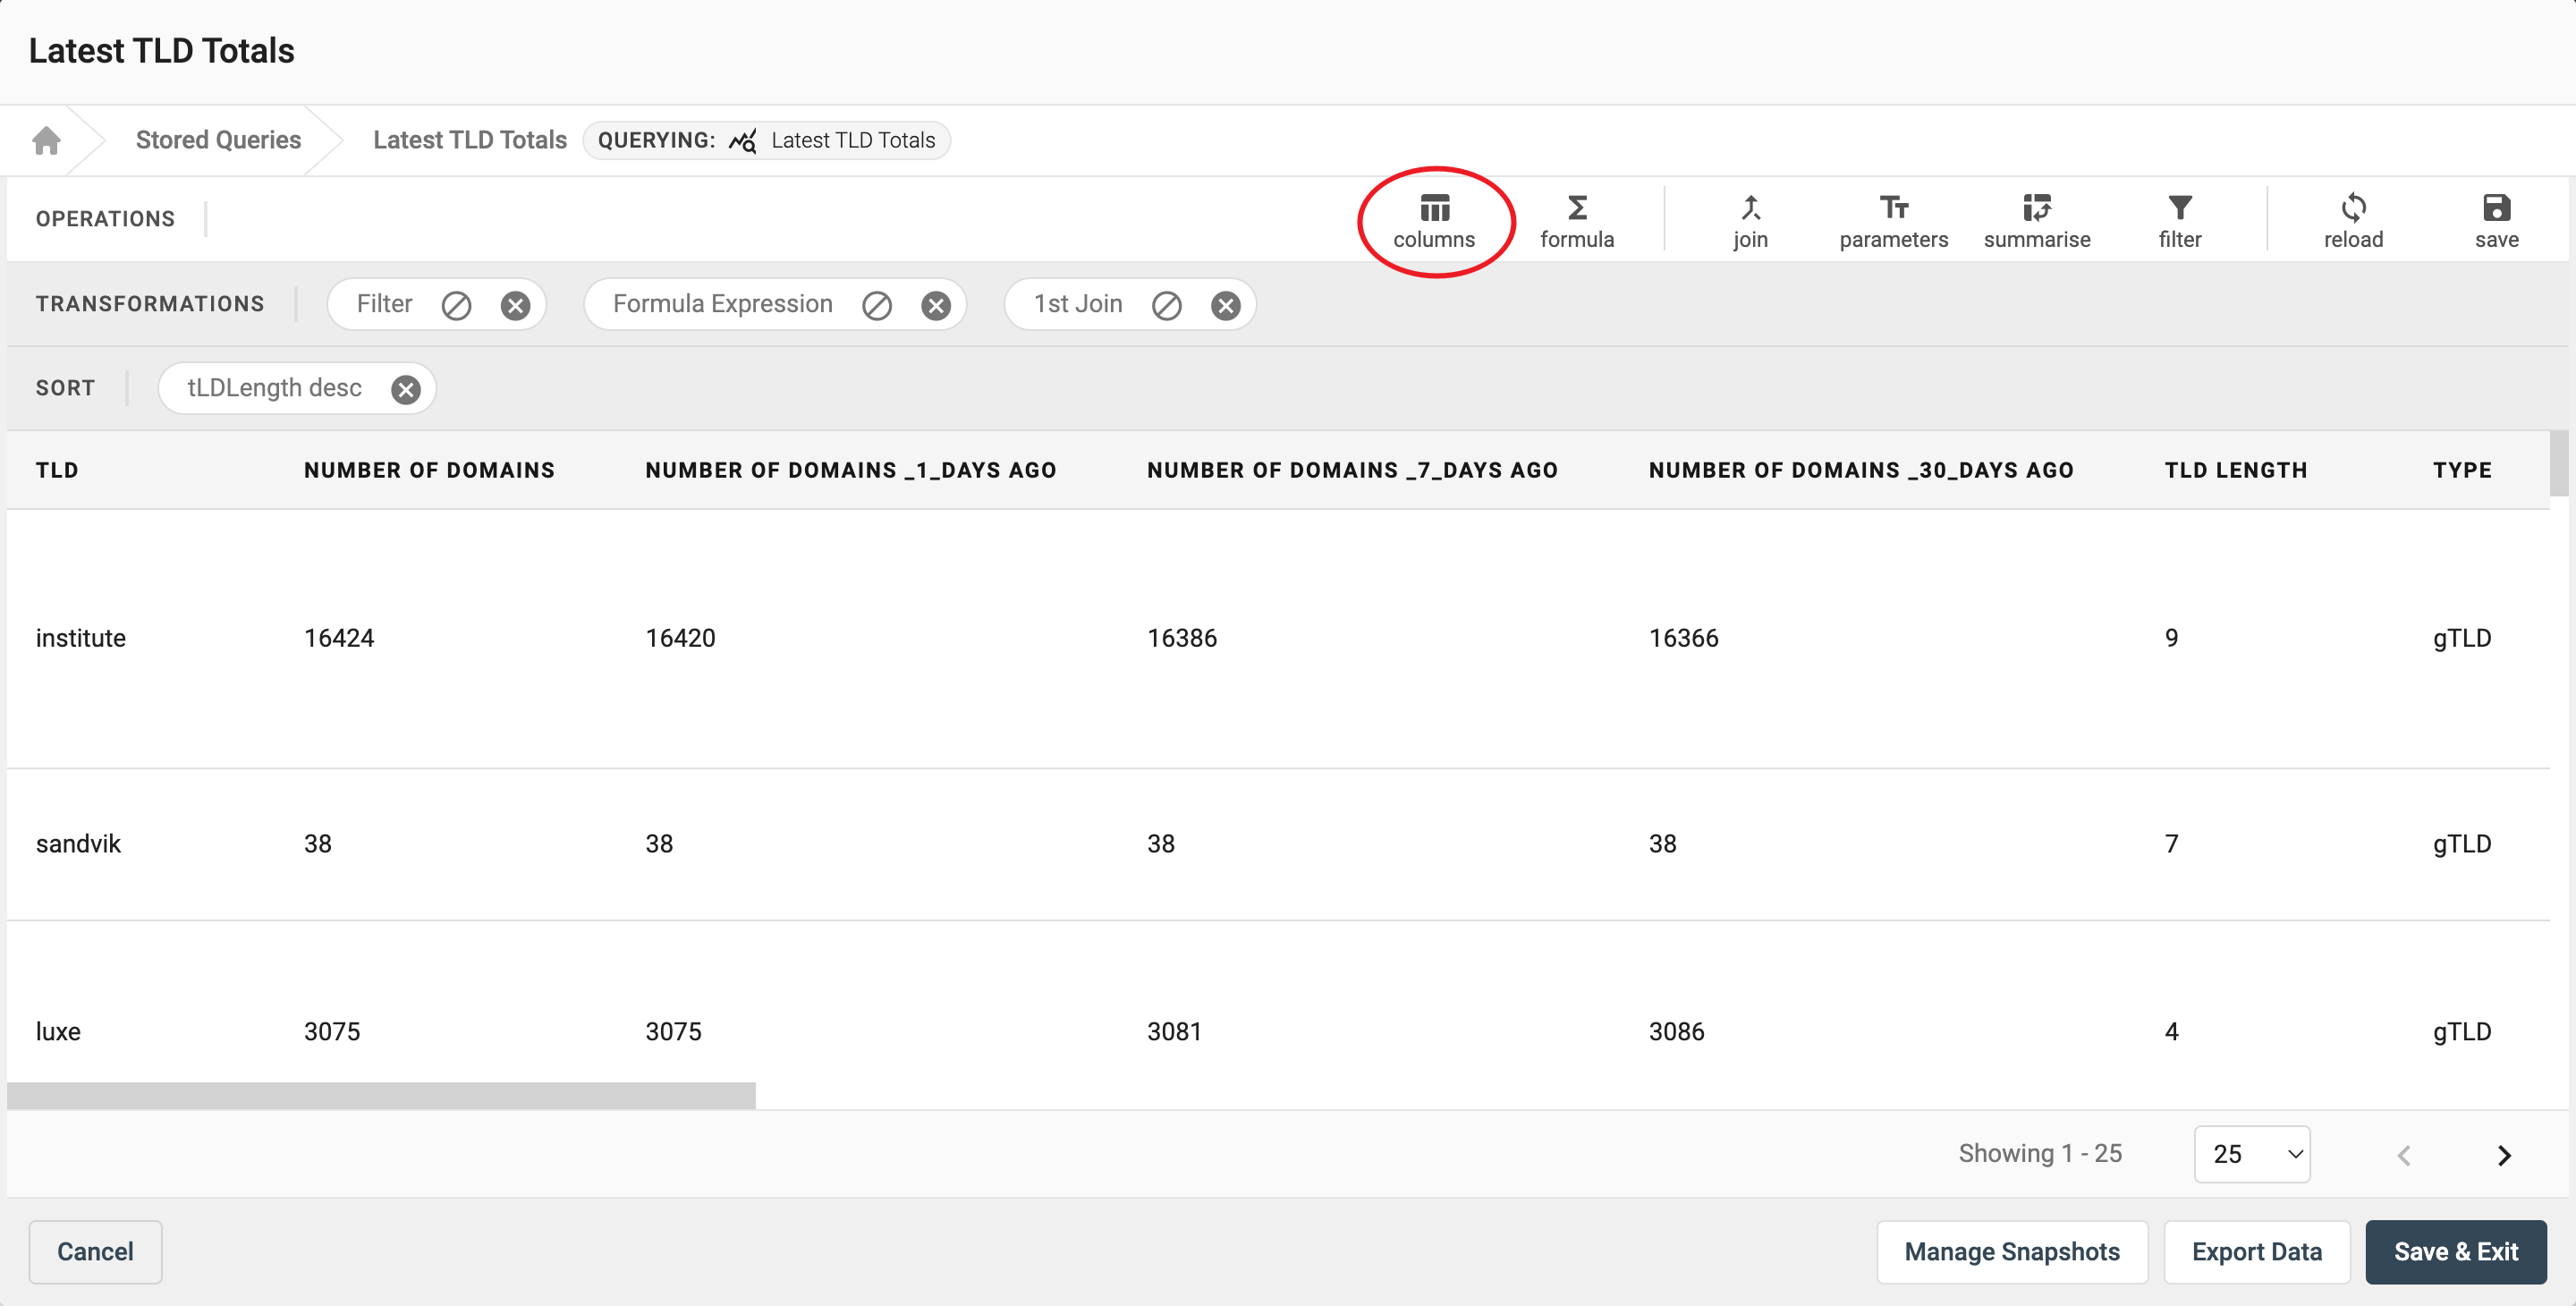
Then deselect any columns you do not need and you can then reorder the remaining columns using the bars on the right. Then Update the Settings for these changes to take effect.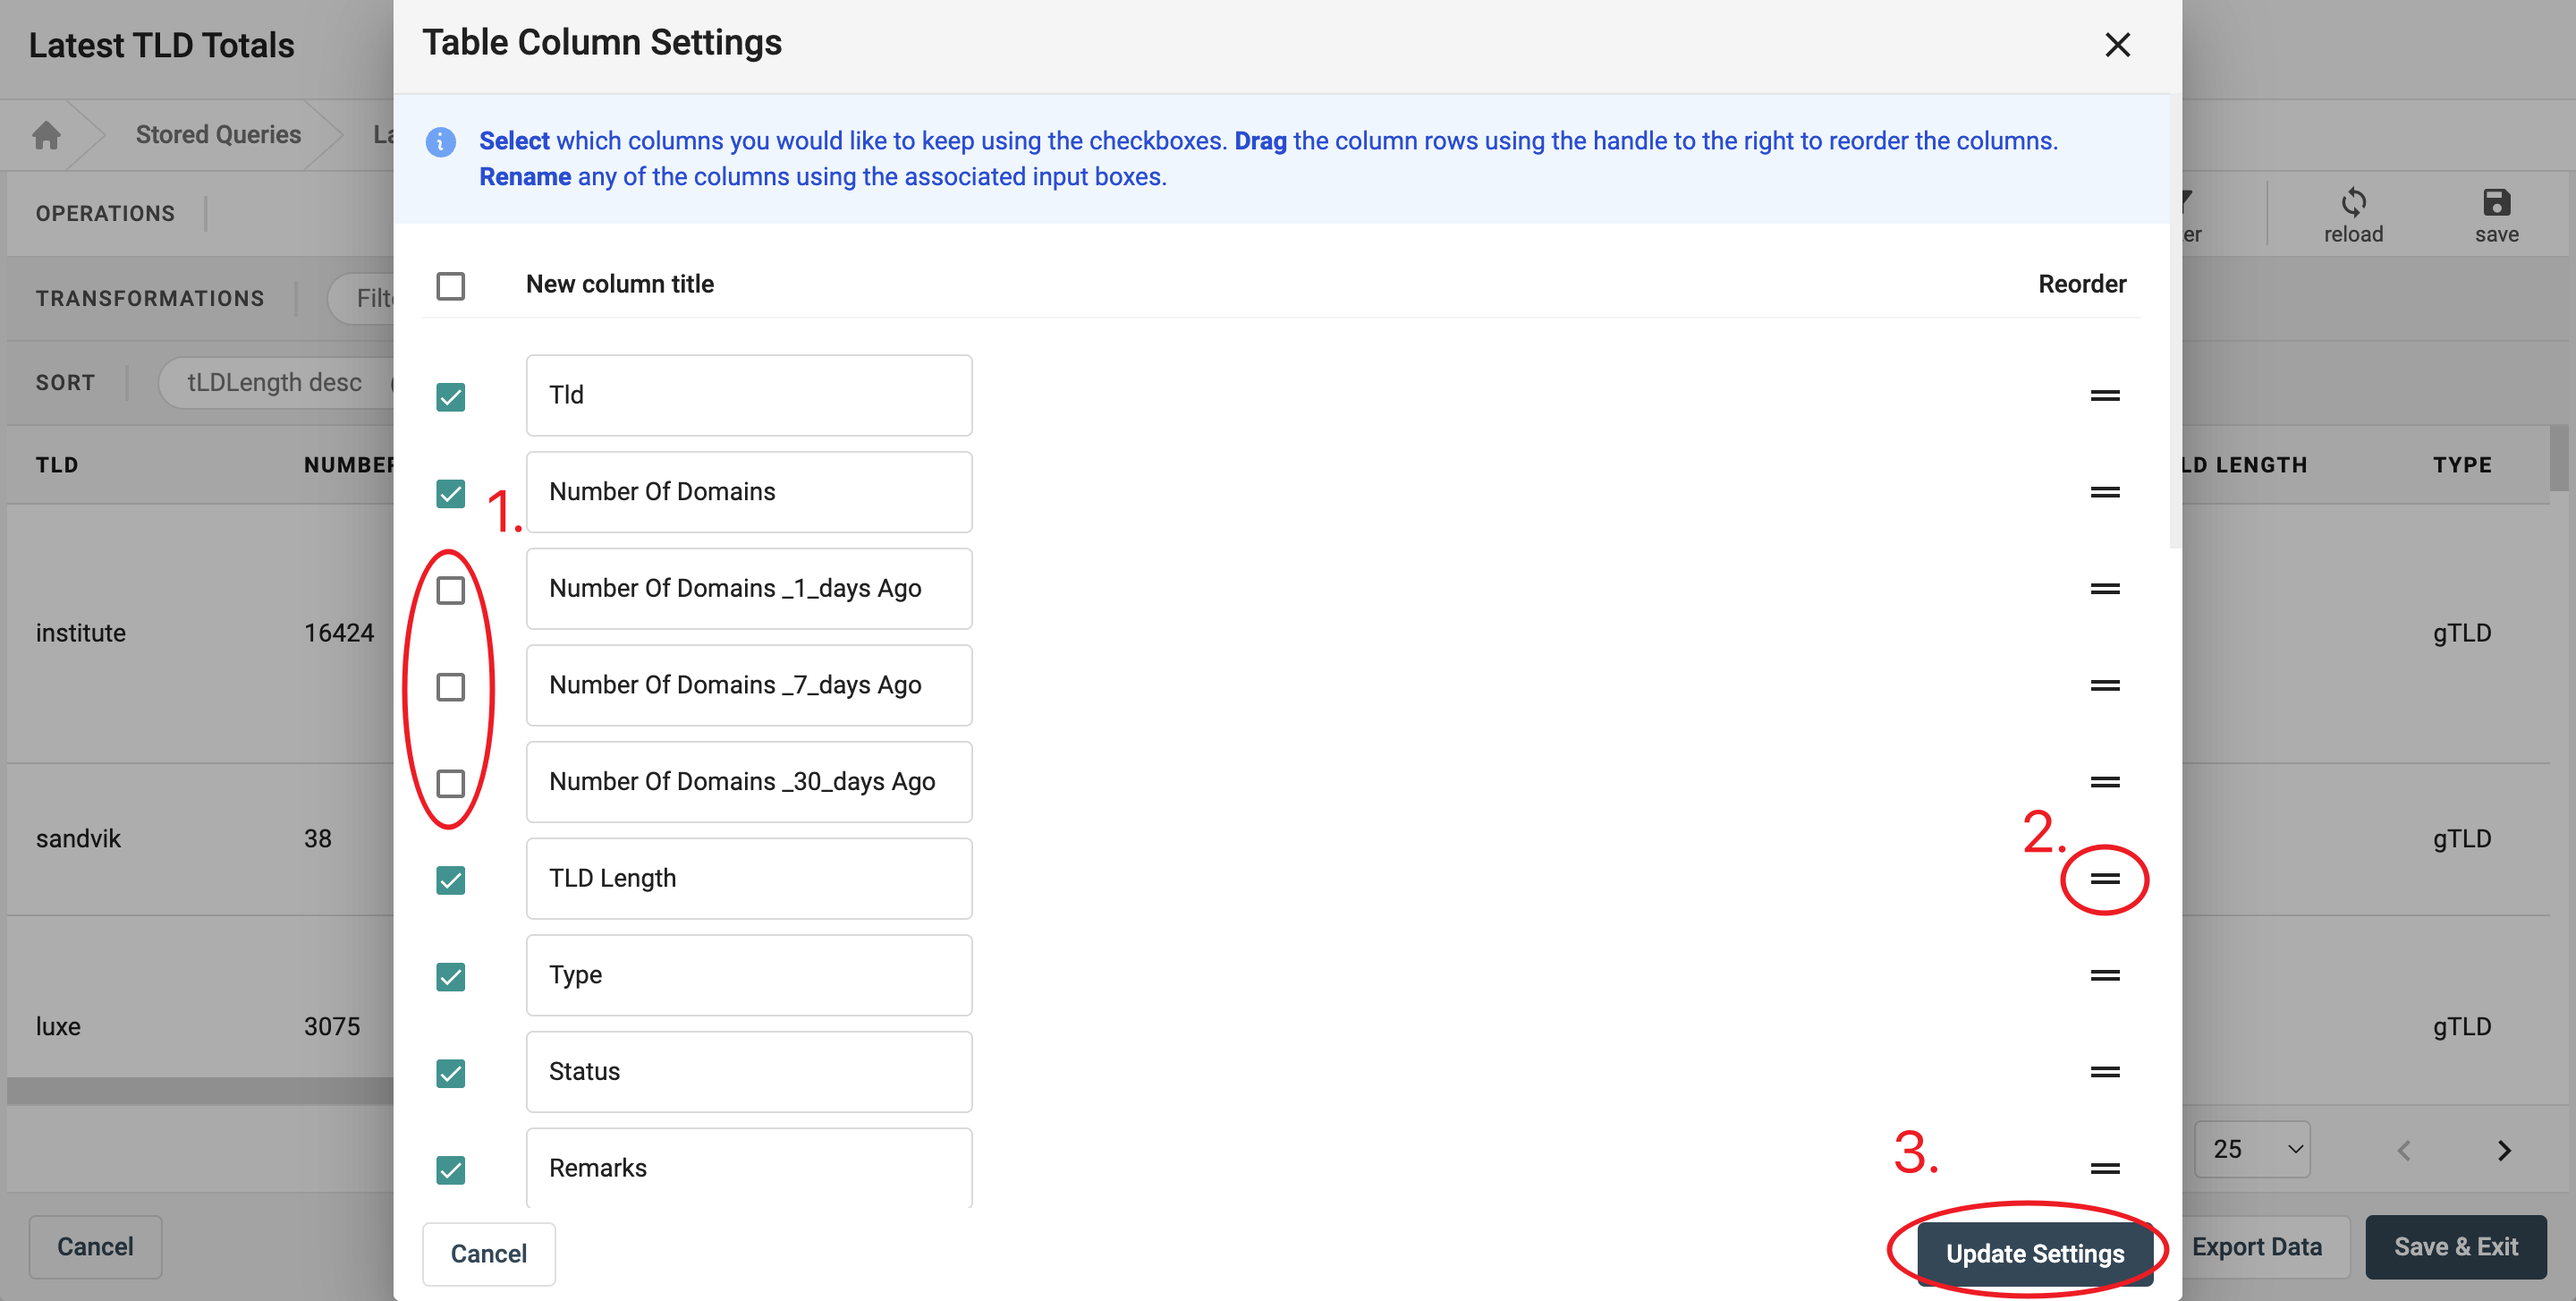
Now save the changes to create a new stored query.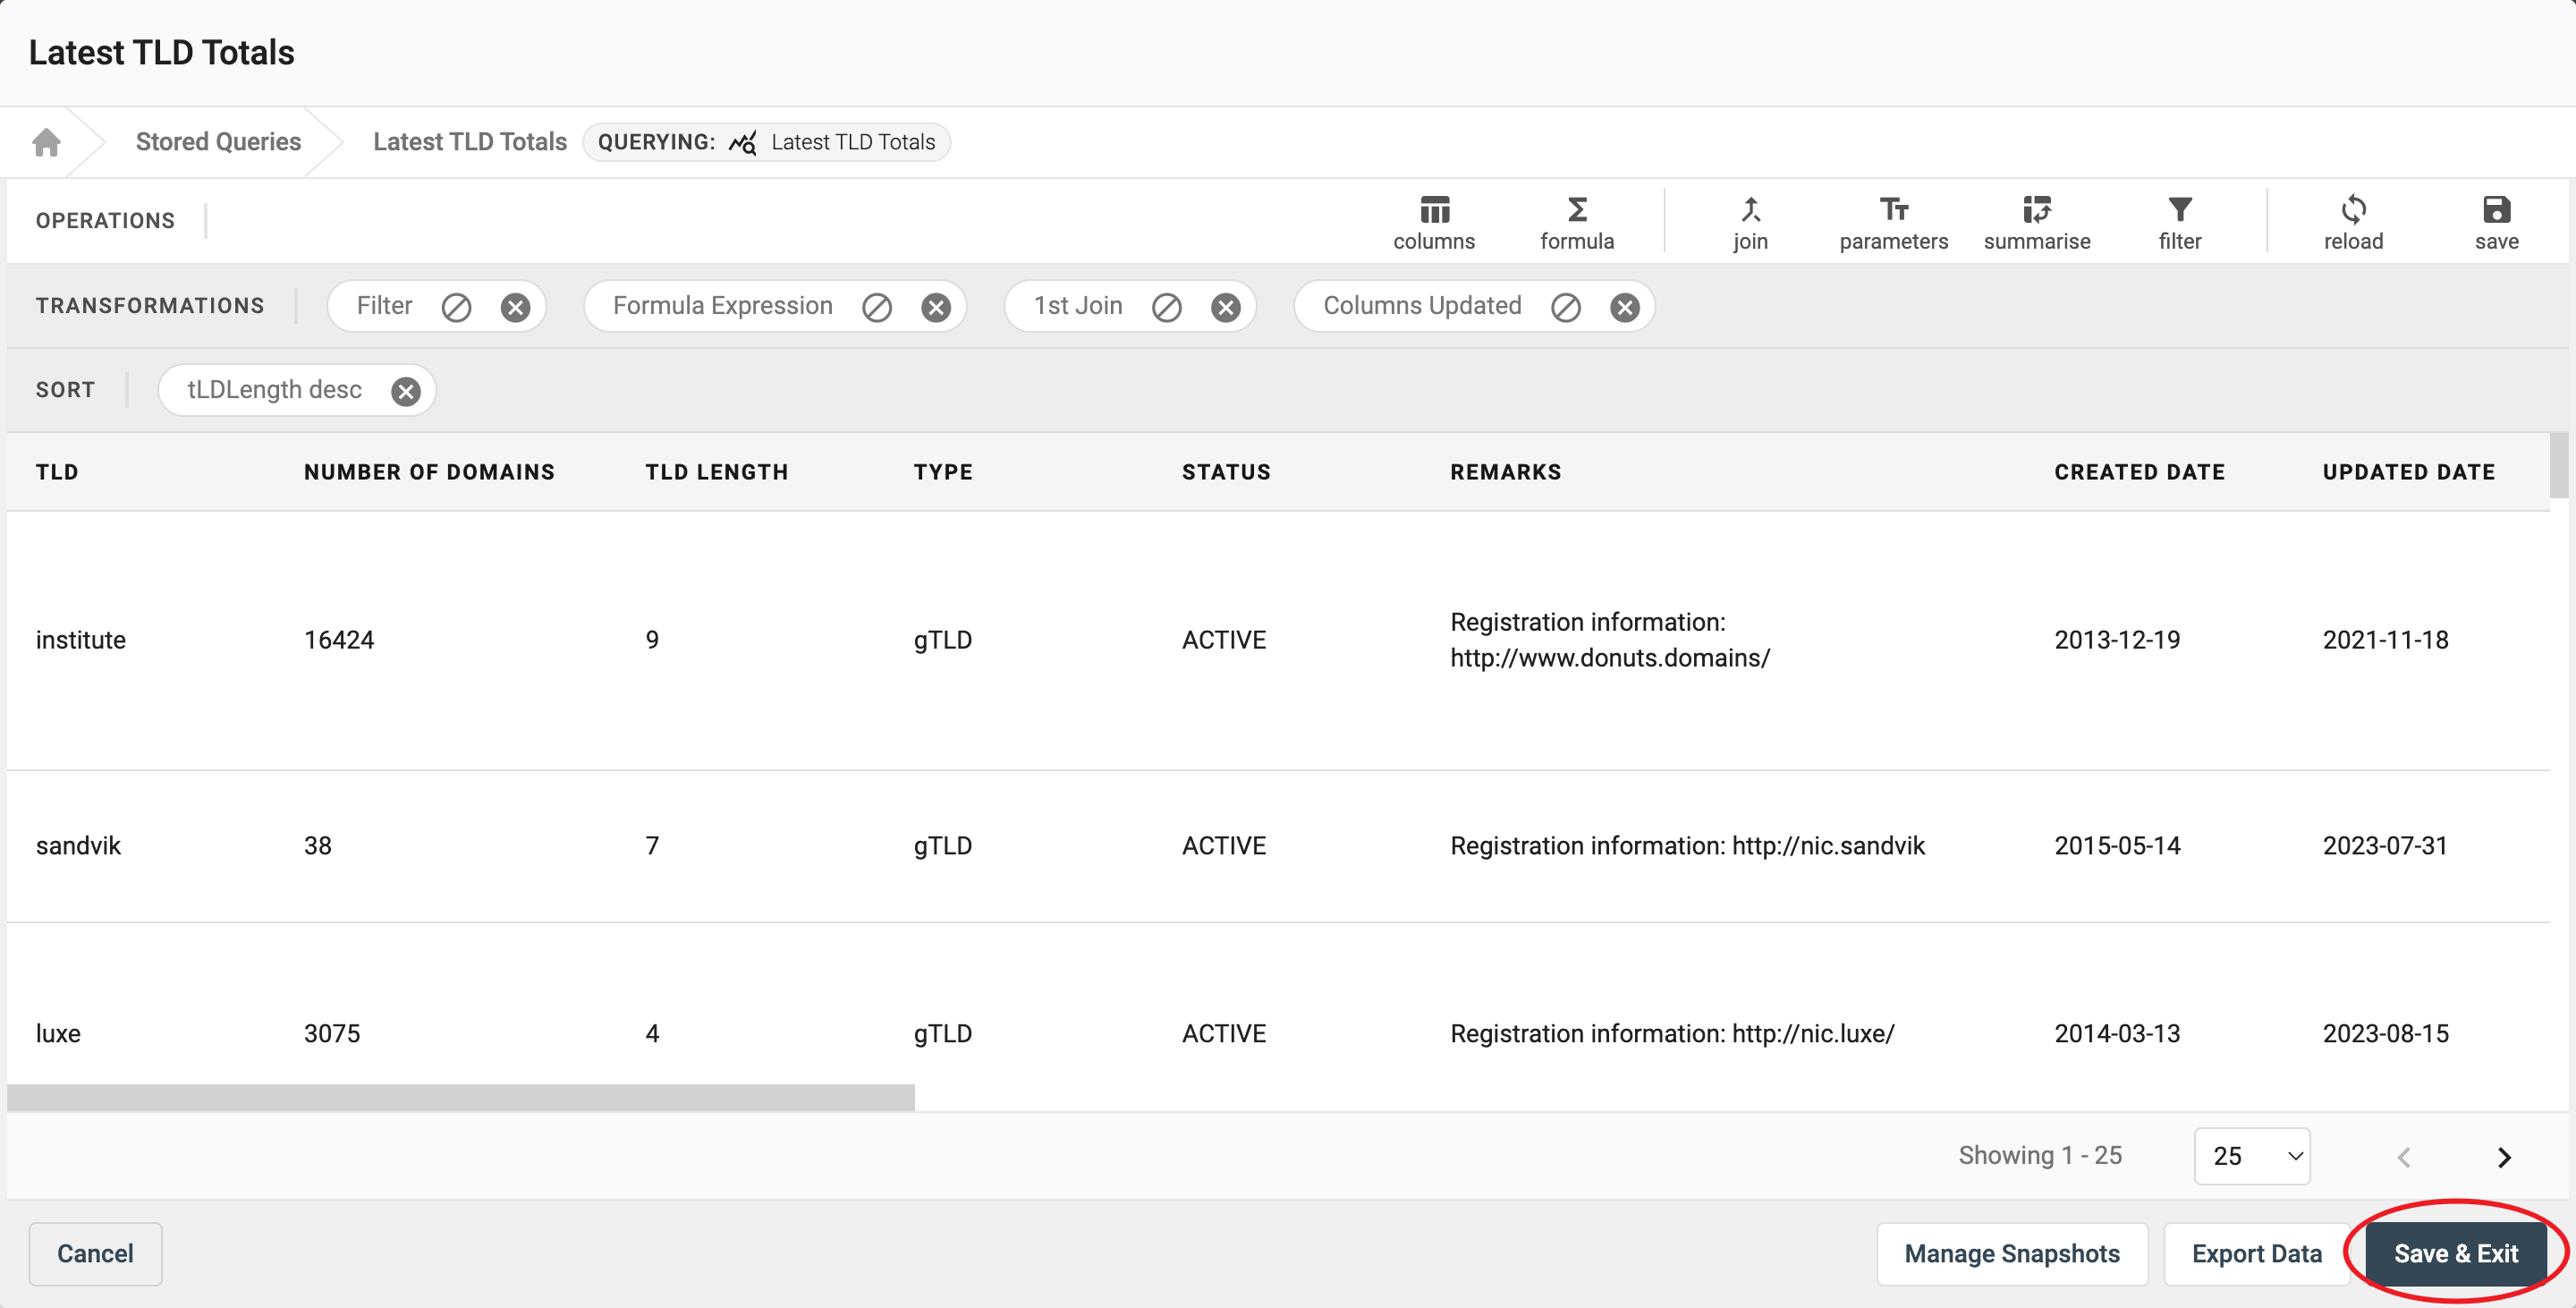
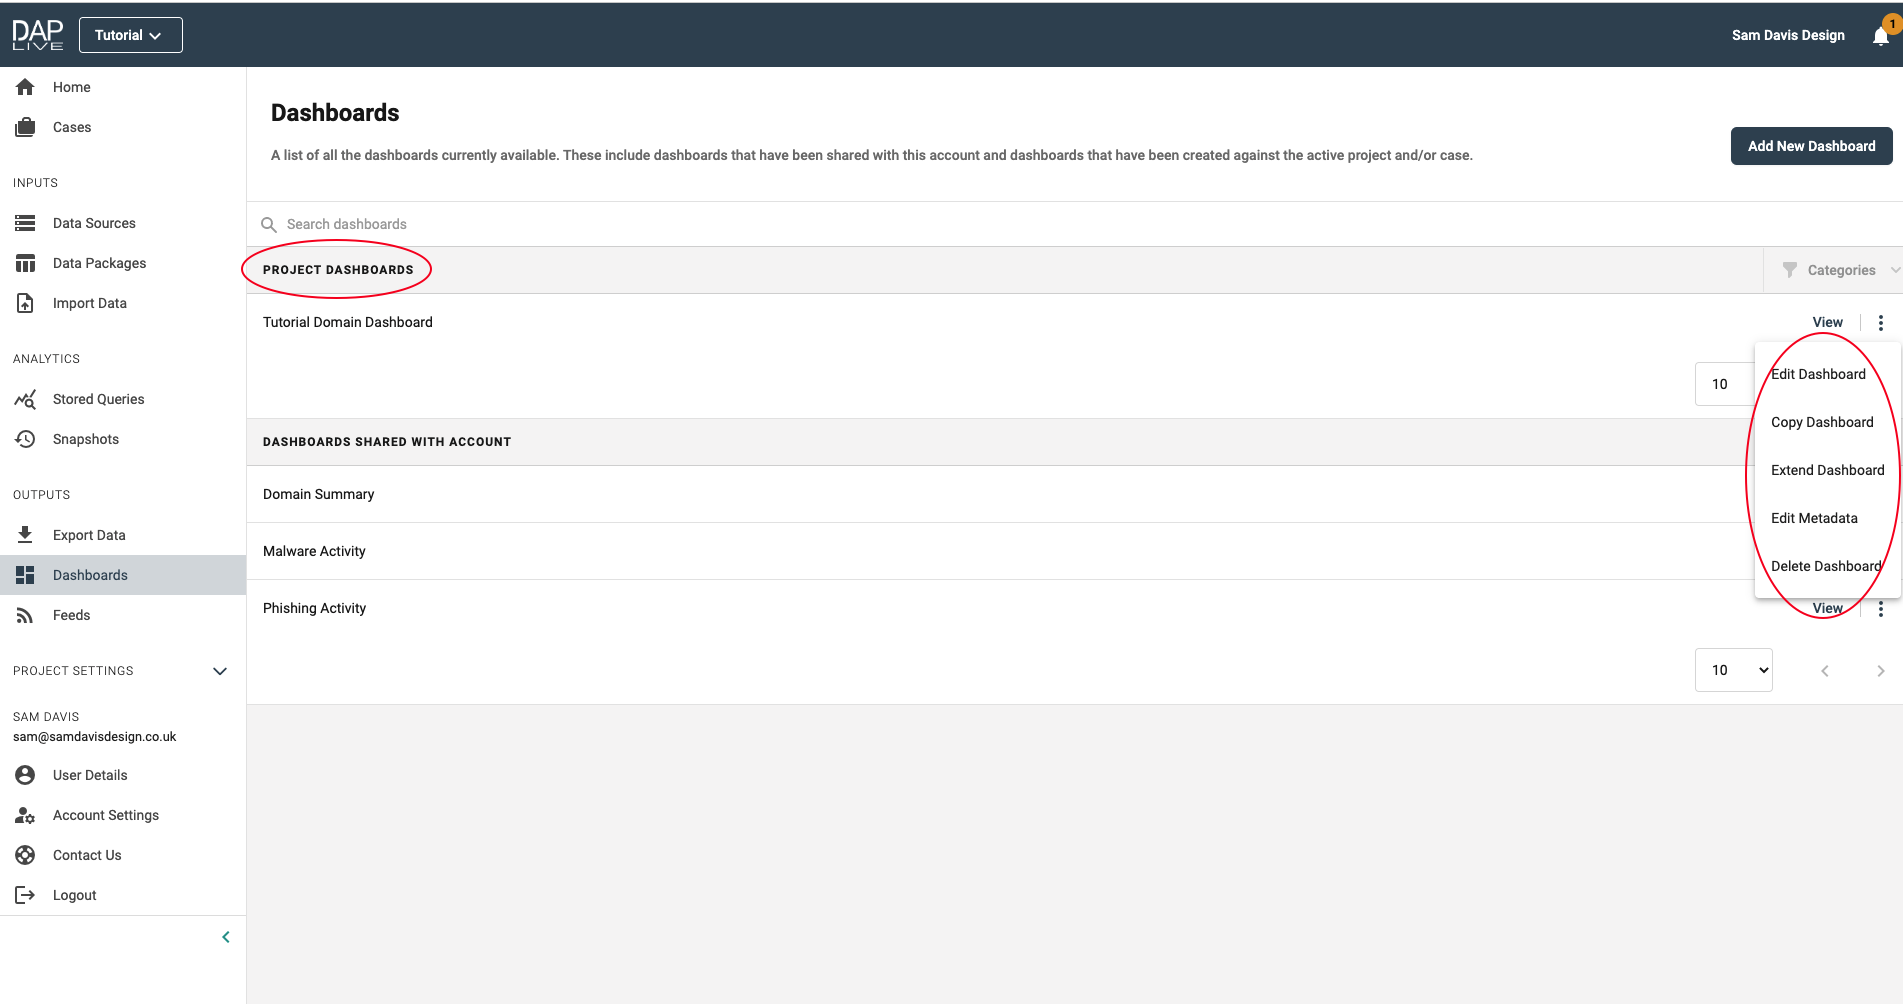
Dashboards
Once you have created you queries from the data packages, you can create fully customisable, visual dashboards to make the data more accessible to the user.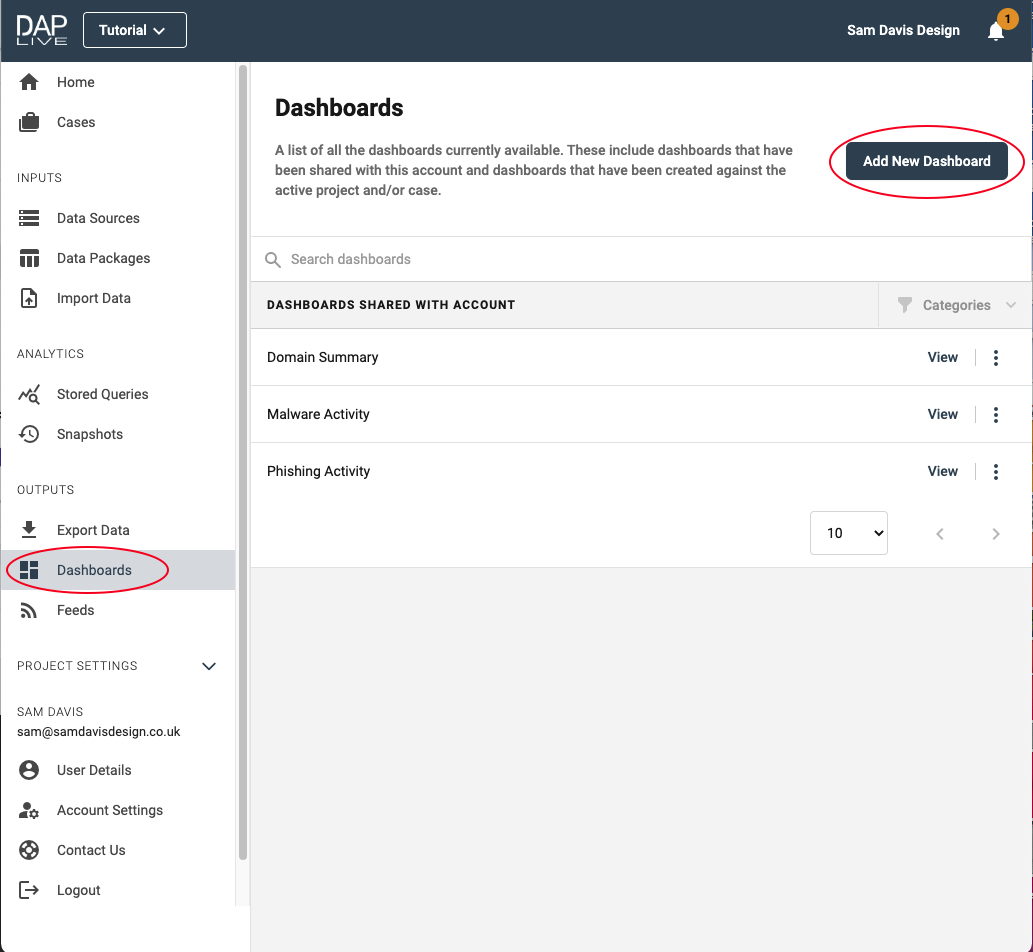
Give your dashboard a title and begin configuring by dragging and dropping which function you would like to include.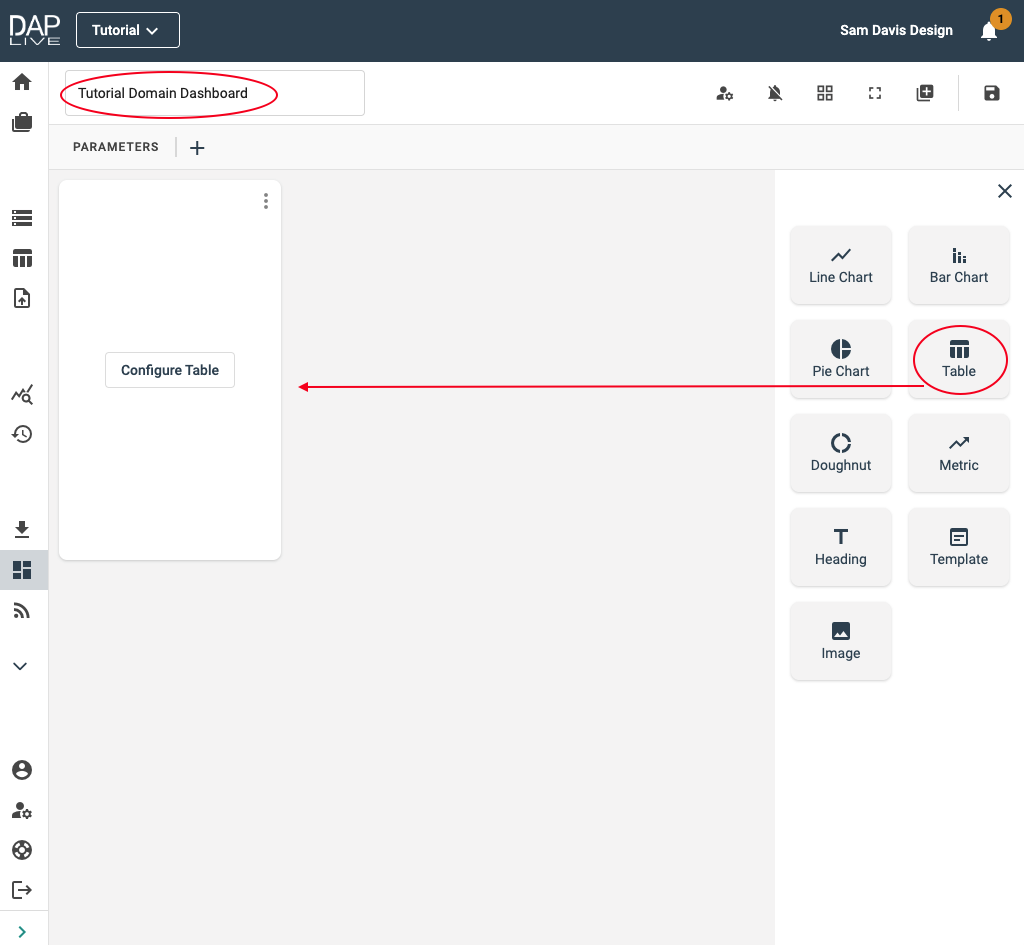
In this example, we are including a Table, Doughnut Chart and Bar Chart. Select which data you would like to create the table using. Then complete a title and head back to the dashboard where you will be able to see the table.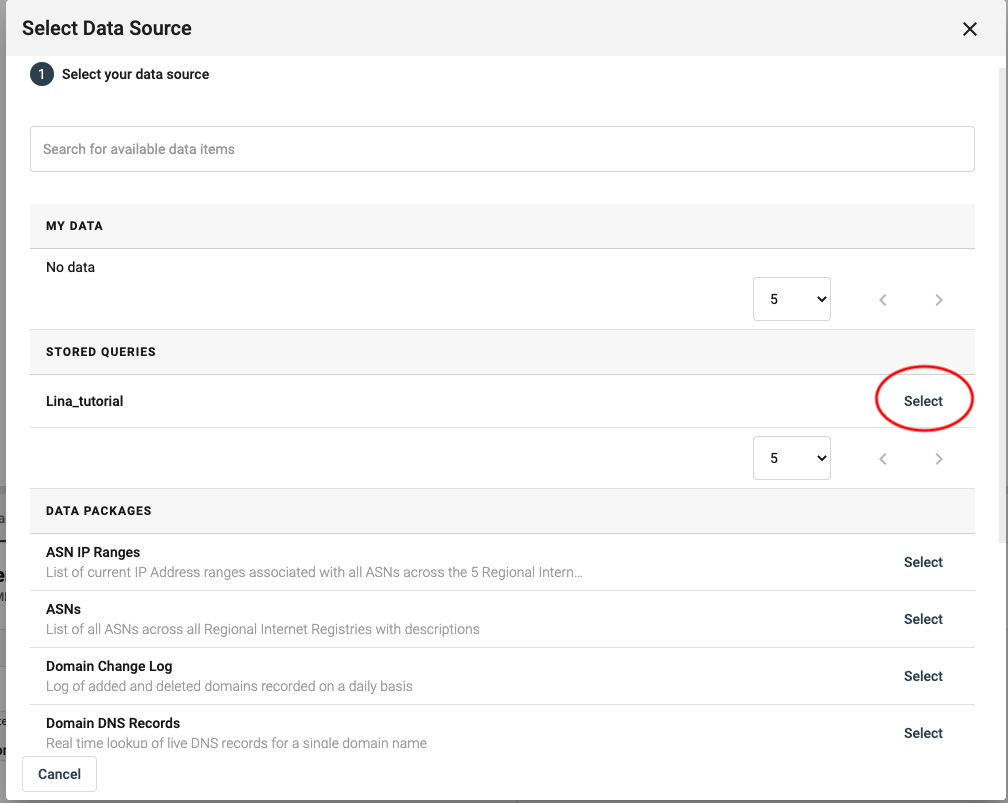
In order to include a chart of any kind, you need to repeat the process above - as well as a few other steps.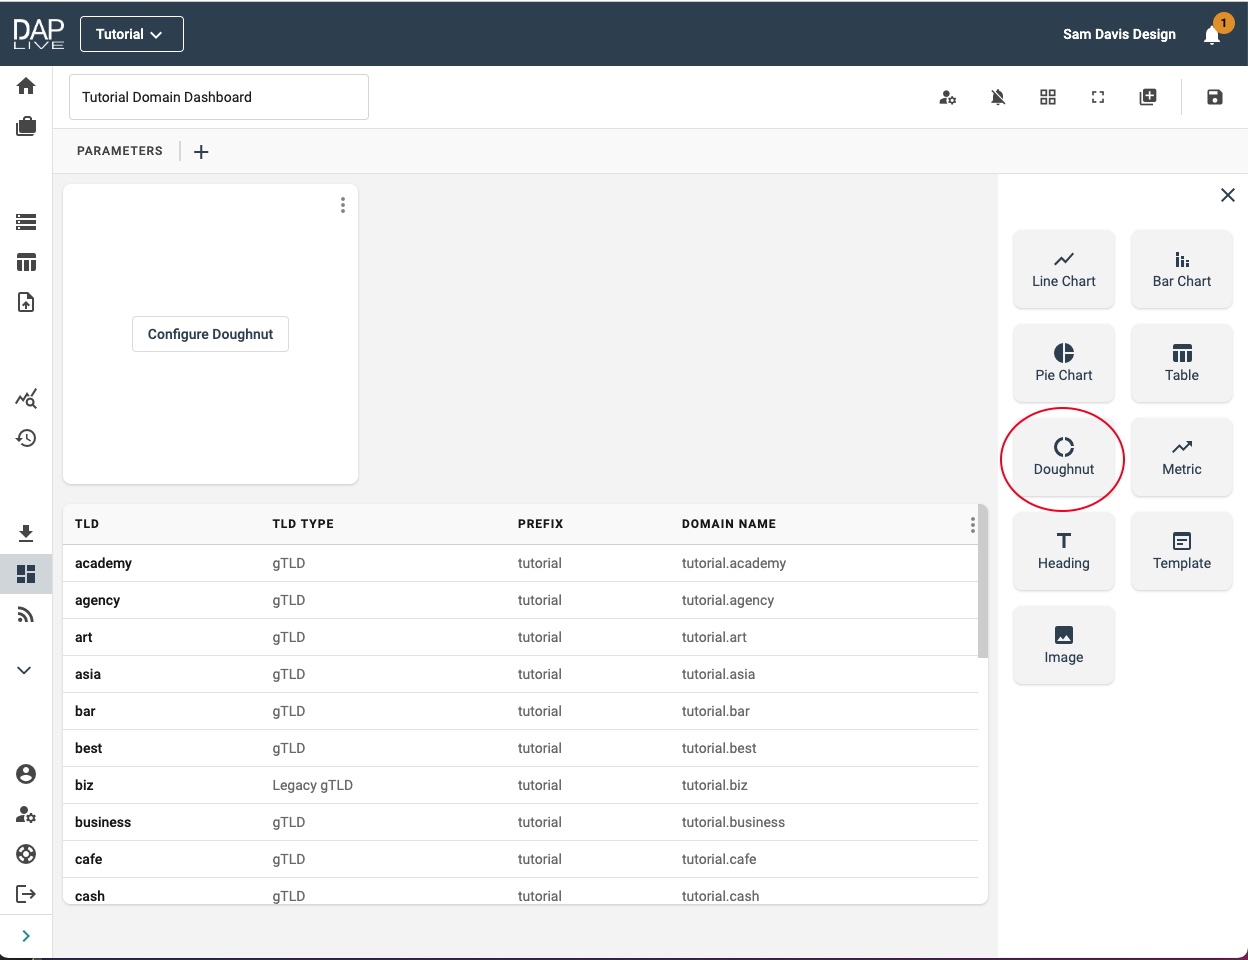
Additionally, you need to summarise the data. In this example we will summarise the Tld type by the total number of domain names.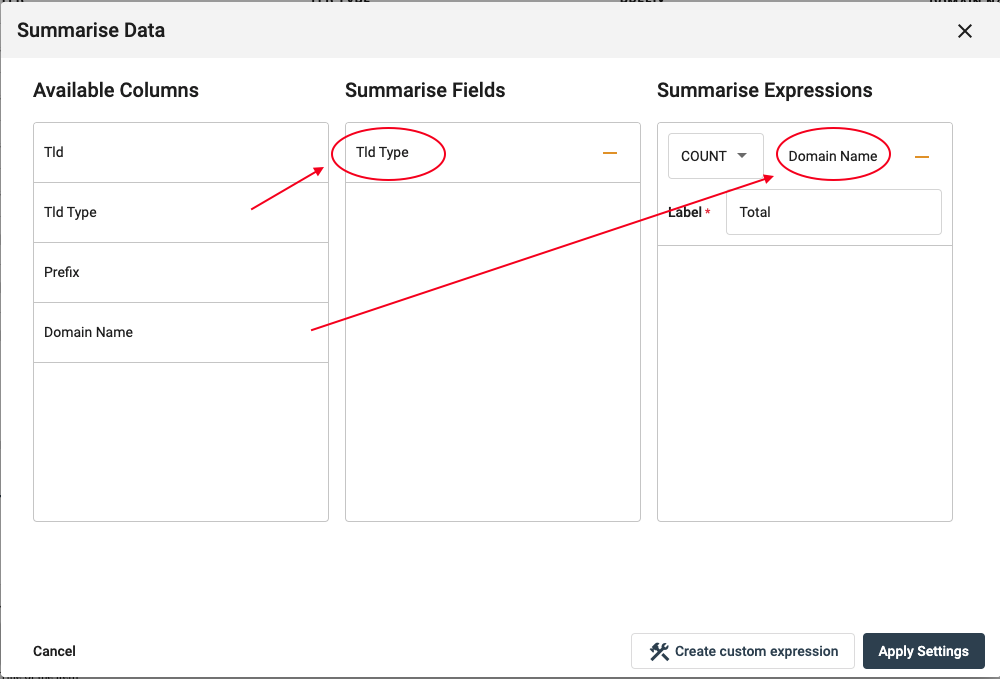
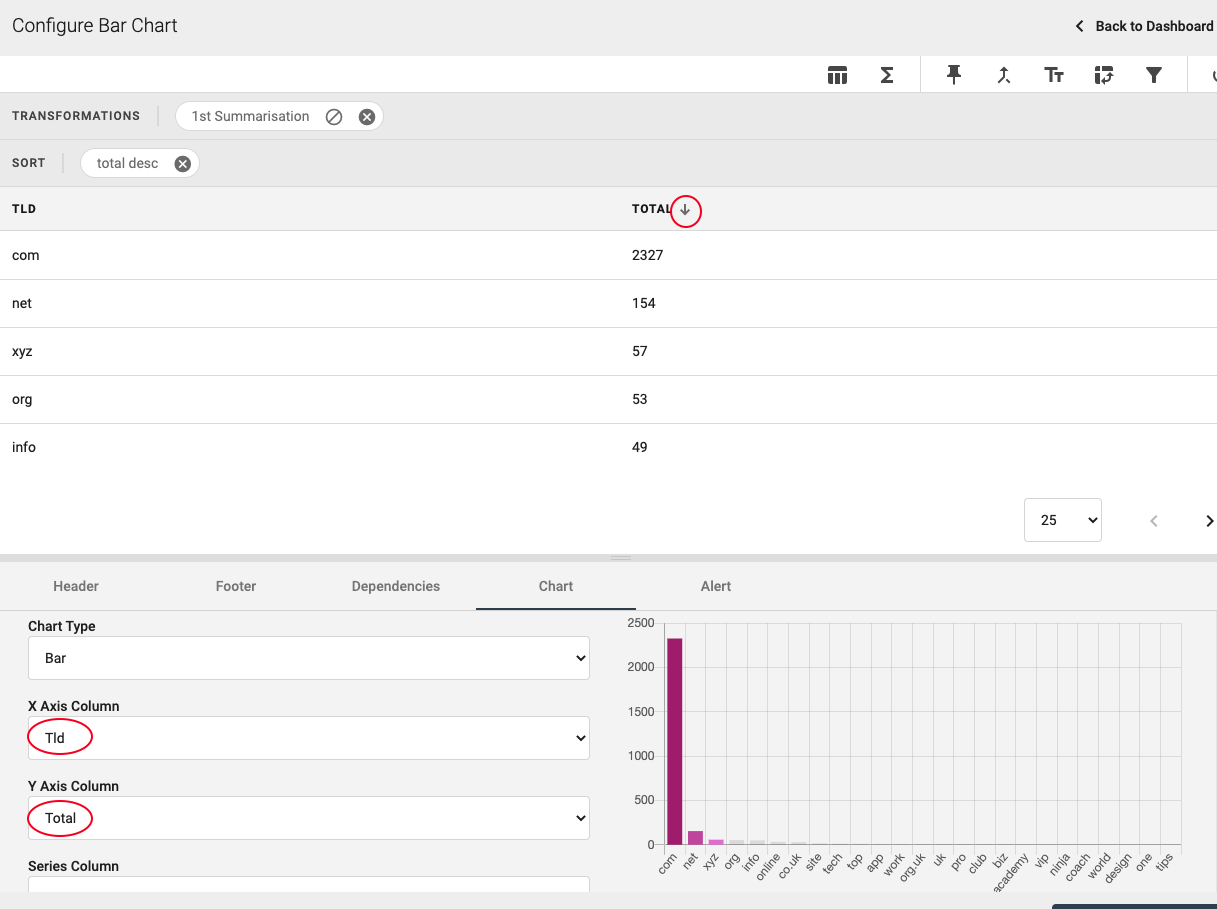
You also need to determine which labels and values are used within the chart. Configure this by selecting the chart header in the bottom window. Here you are also able to select a colour gradient for your chart.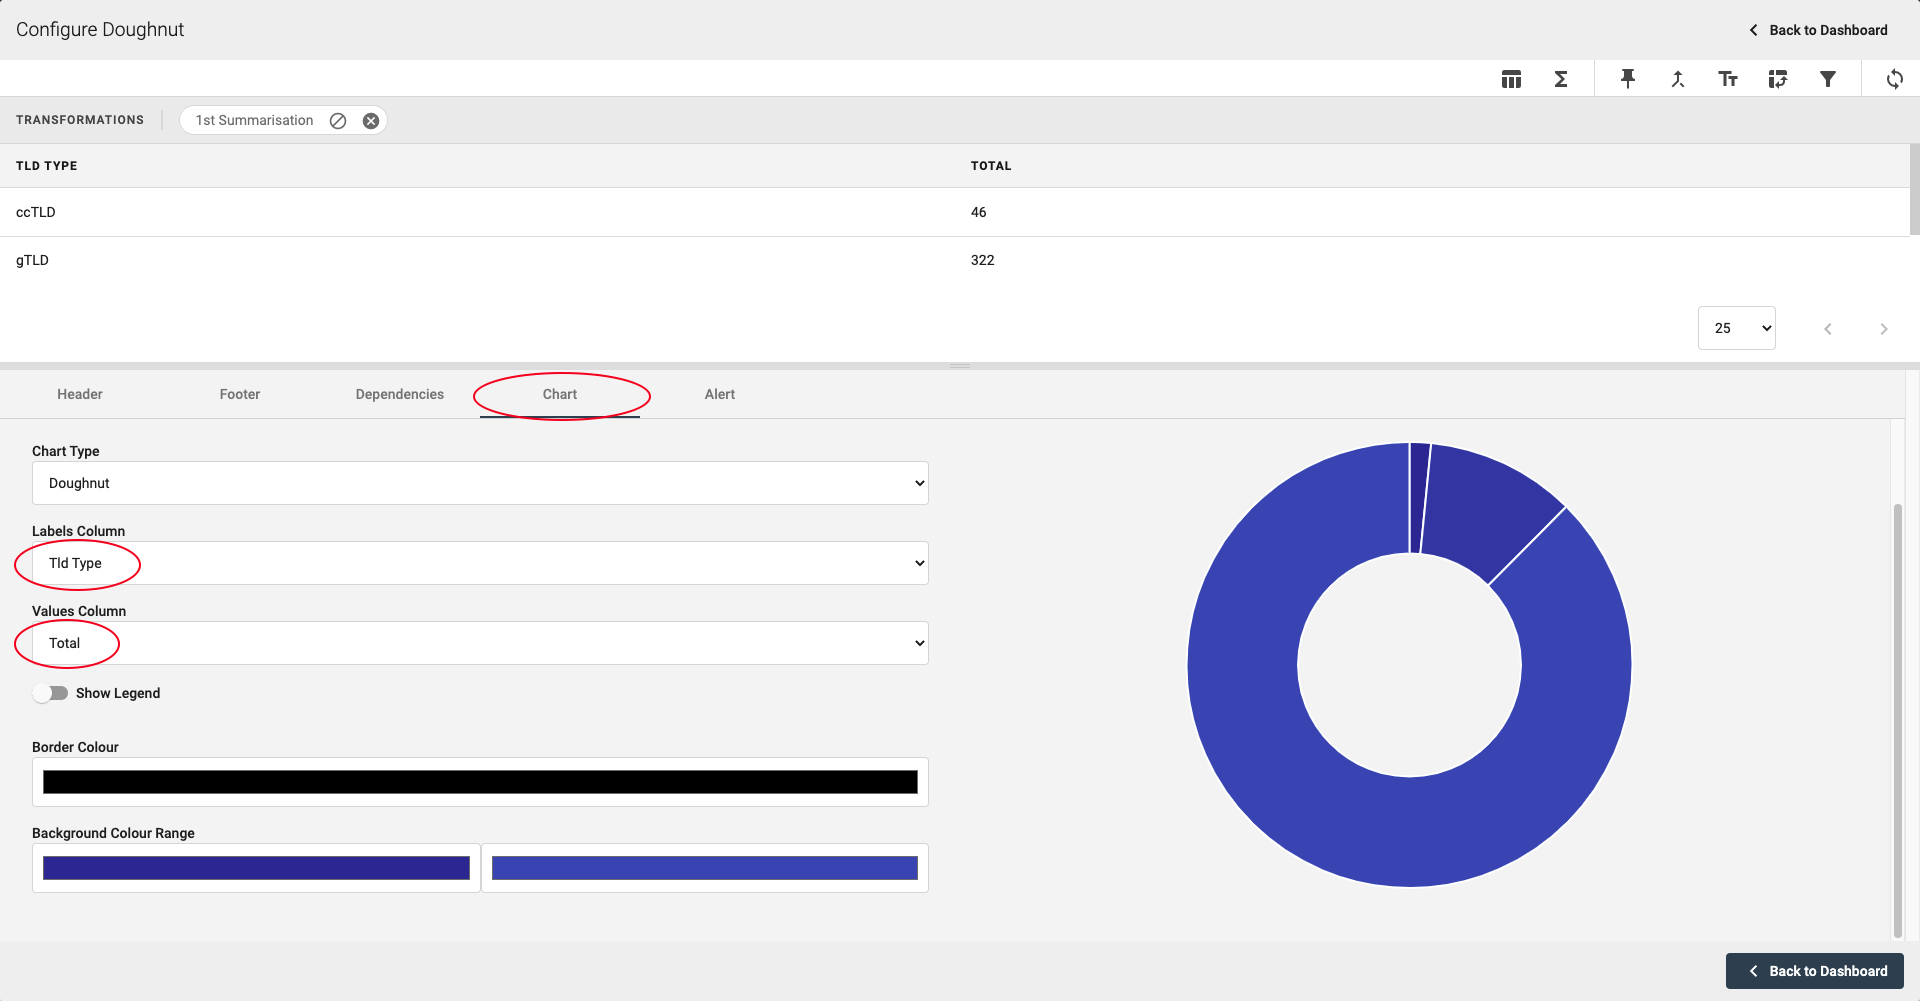
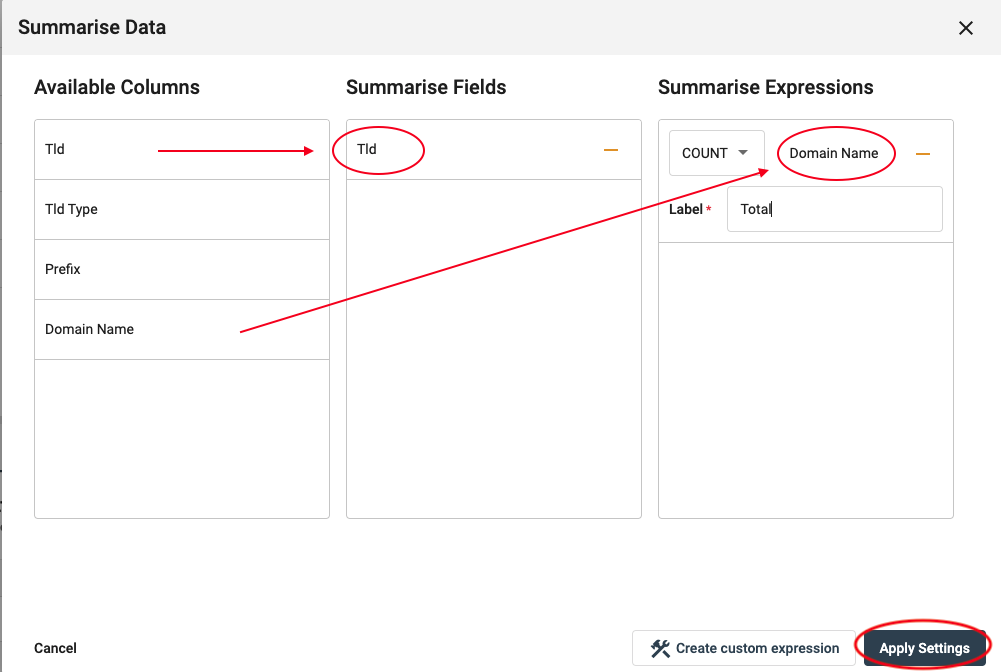
In order to include a bar chart, follow a similar process as above; selecting the different data you want displayed.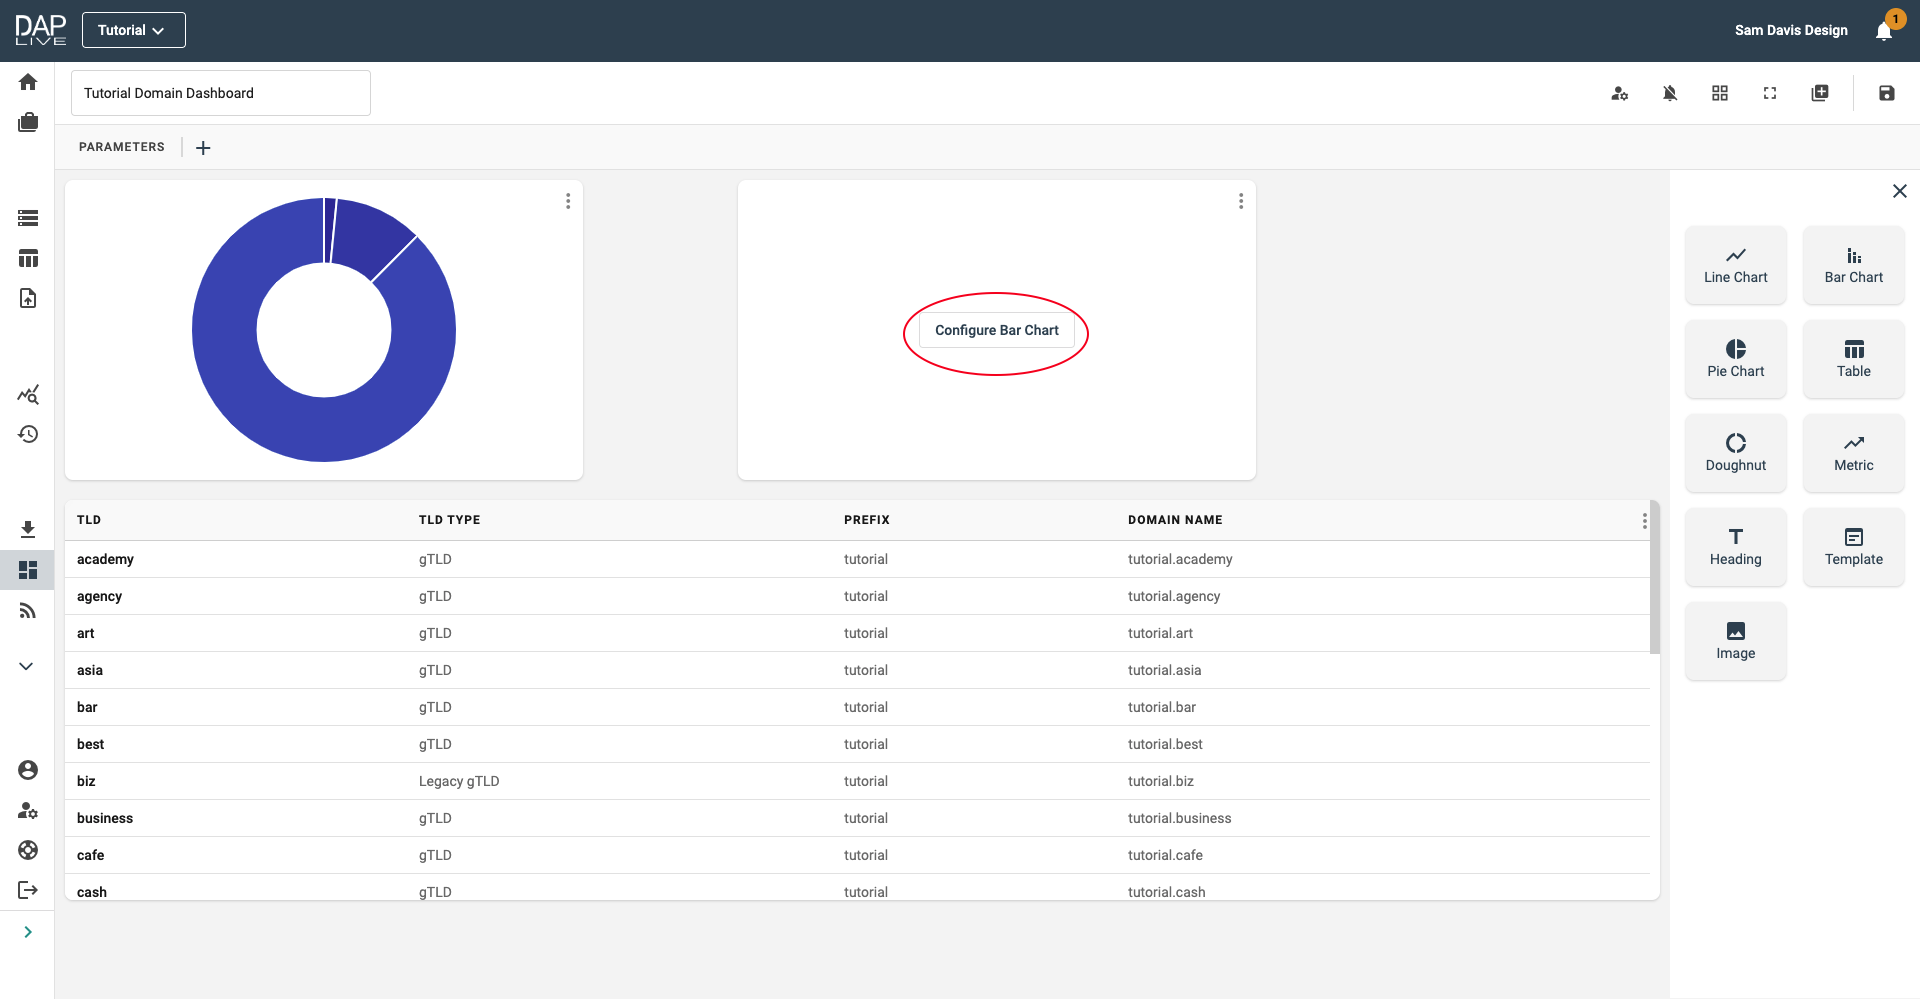
Once you have completed your dashboard, save it.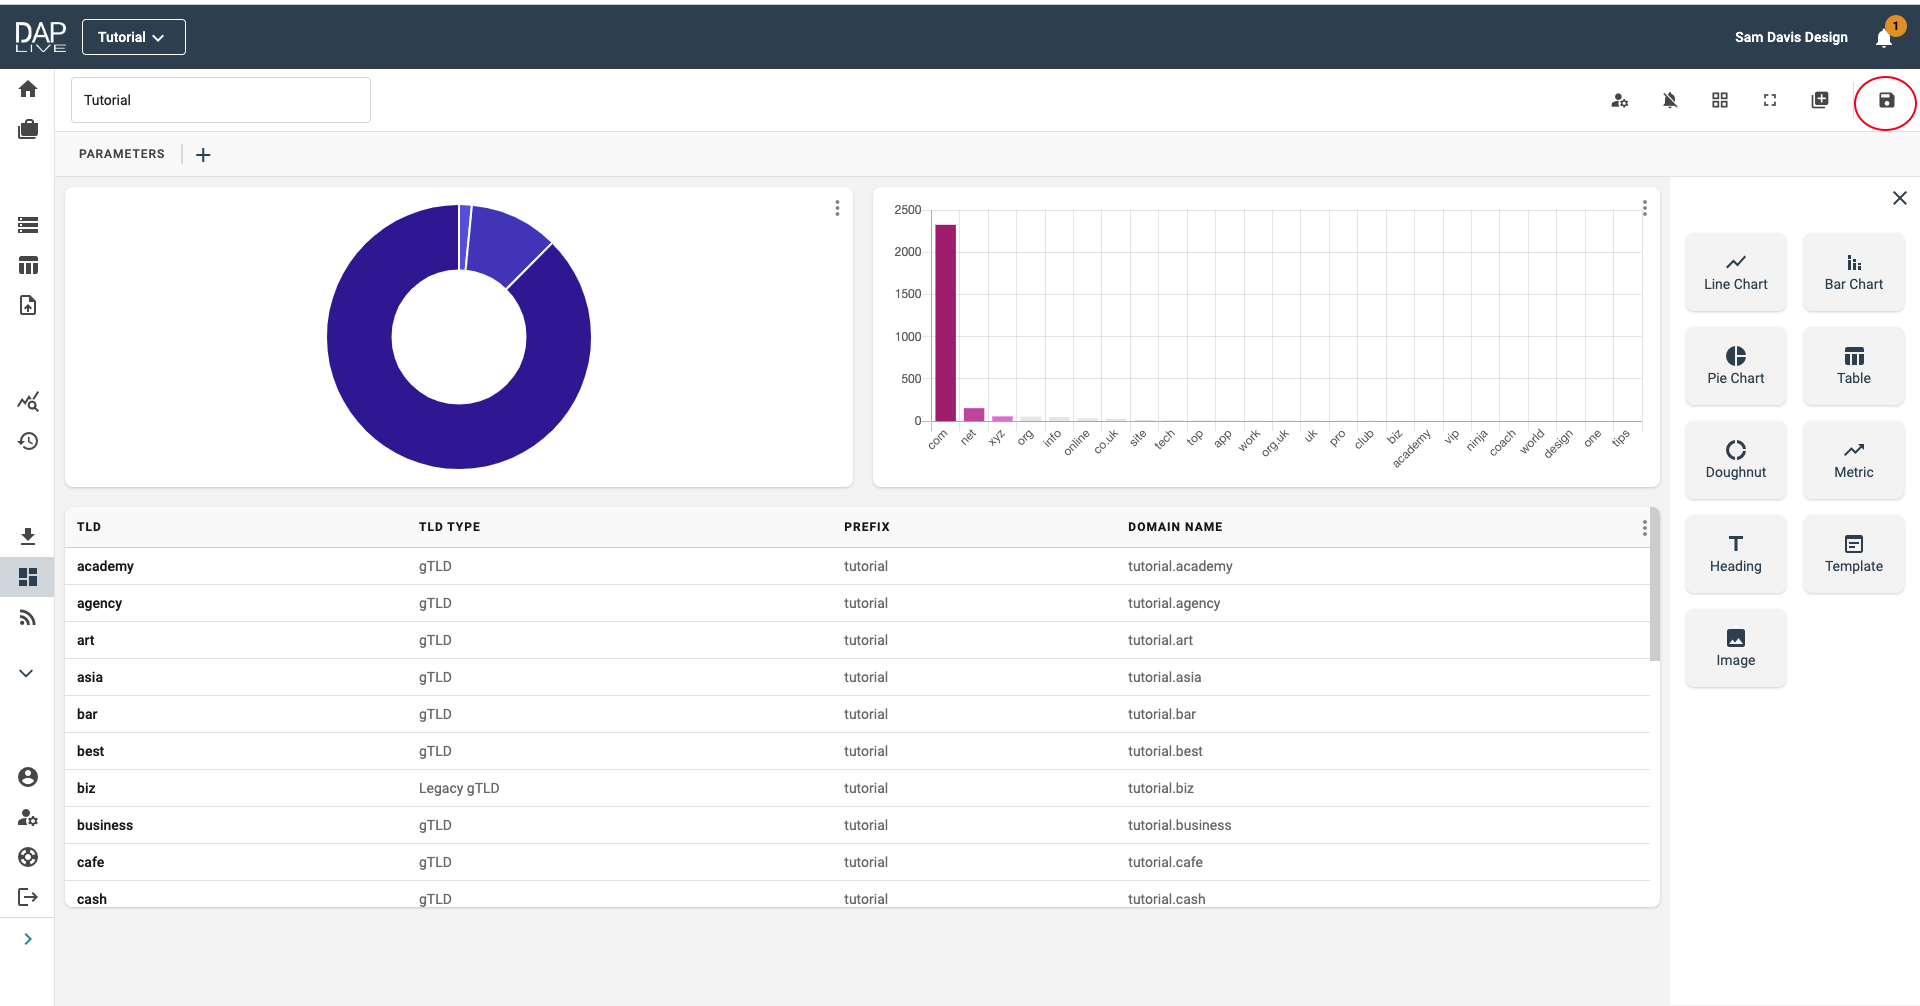
You can view all your project dashboards within your account at any time and they will update to give you the most up to date data within the DAP.LIVE system.