It can be very useful to present your data as a Table.
Table Icon
Give your dashboard a title and begin configuring by dragging and dropping the Table icon onto the screen. Then click 'Configure Table'.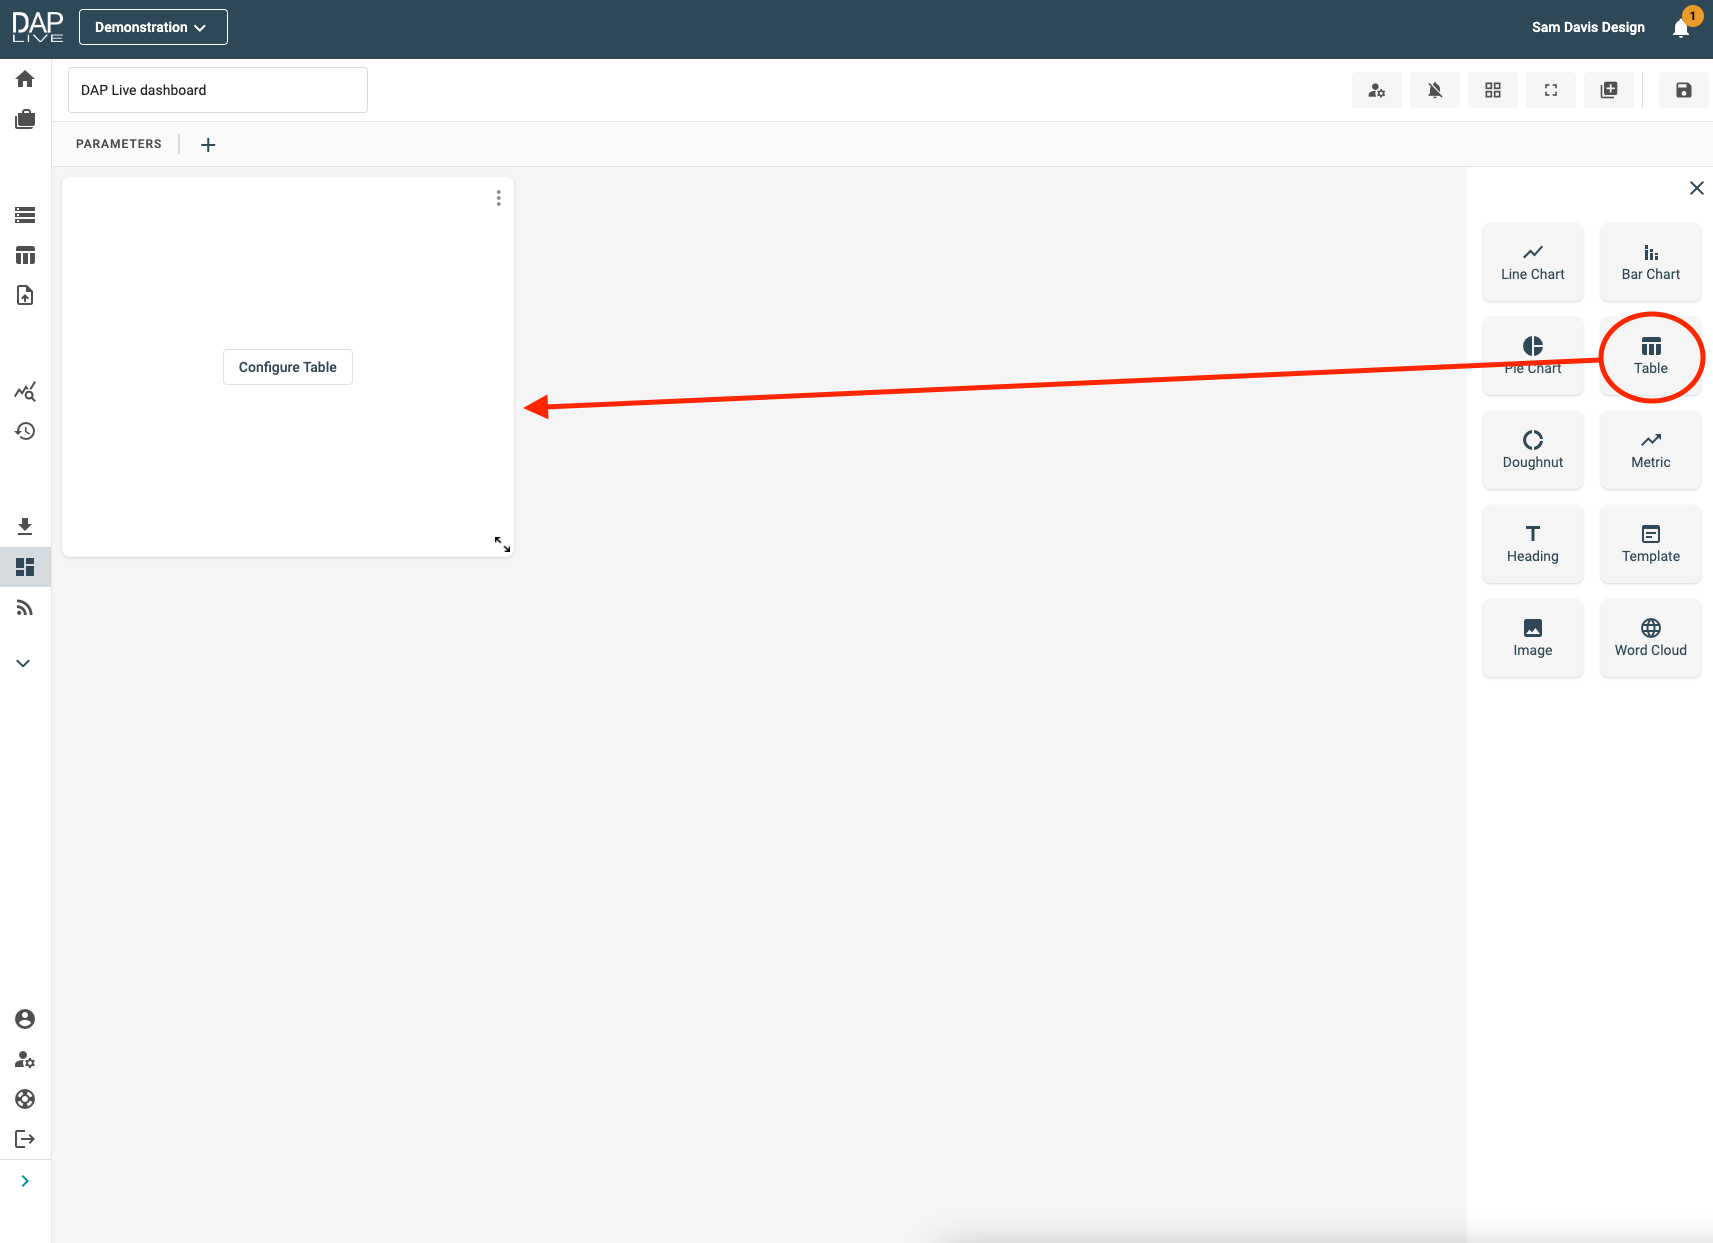
Choosing Your Data Source
Select which data, stored query, data feed or snapshot you would like to create a Table from.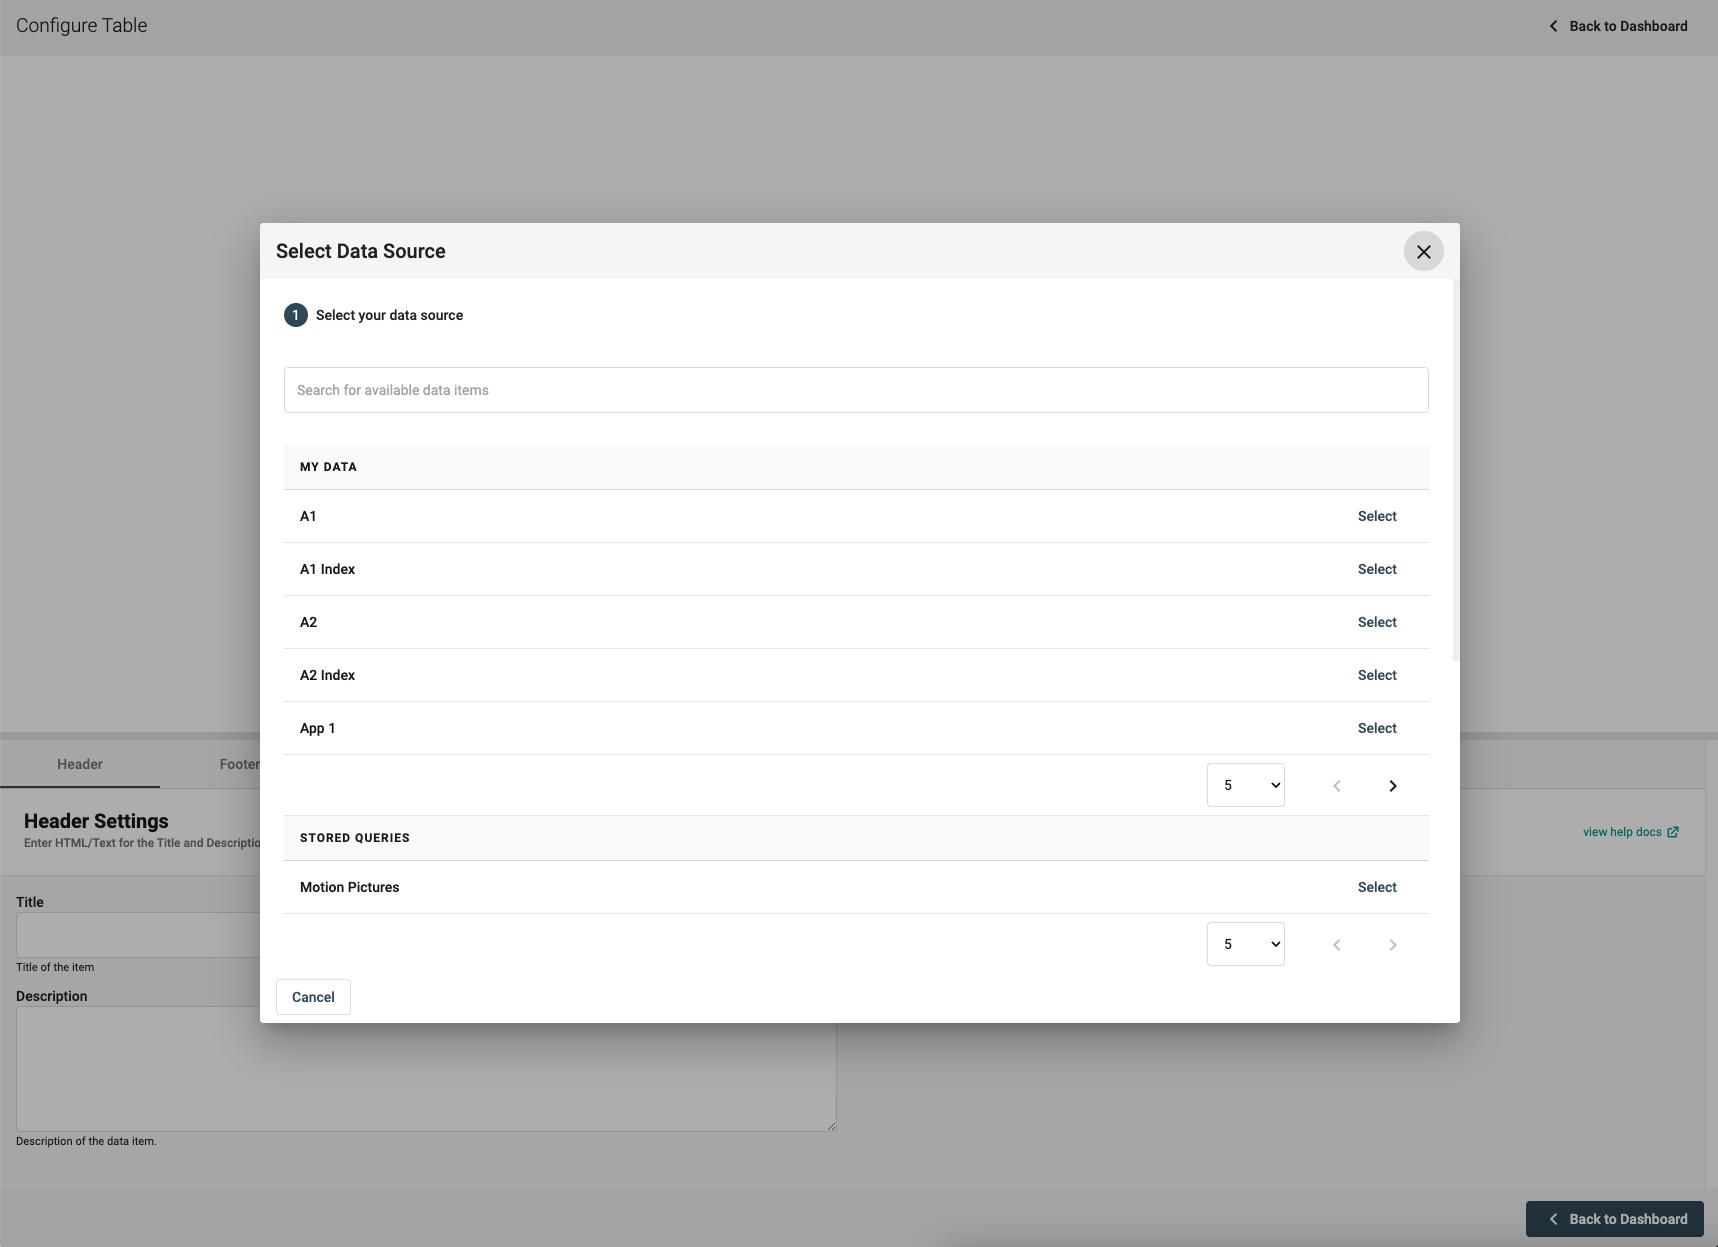
Row Settings
Name your Table under the 'Header' section and then click on the 'Rows' section. Here you will be able to redirect people to another dashboard or link by ticking the 'Make table rows clickable' box and selecting your desired dashboard or 'Custom Link'.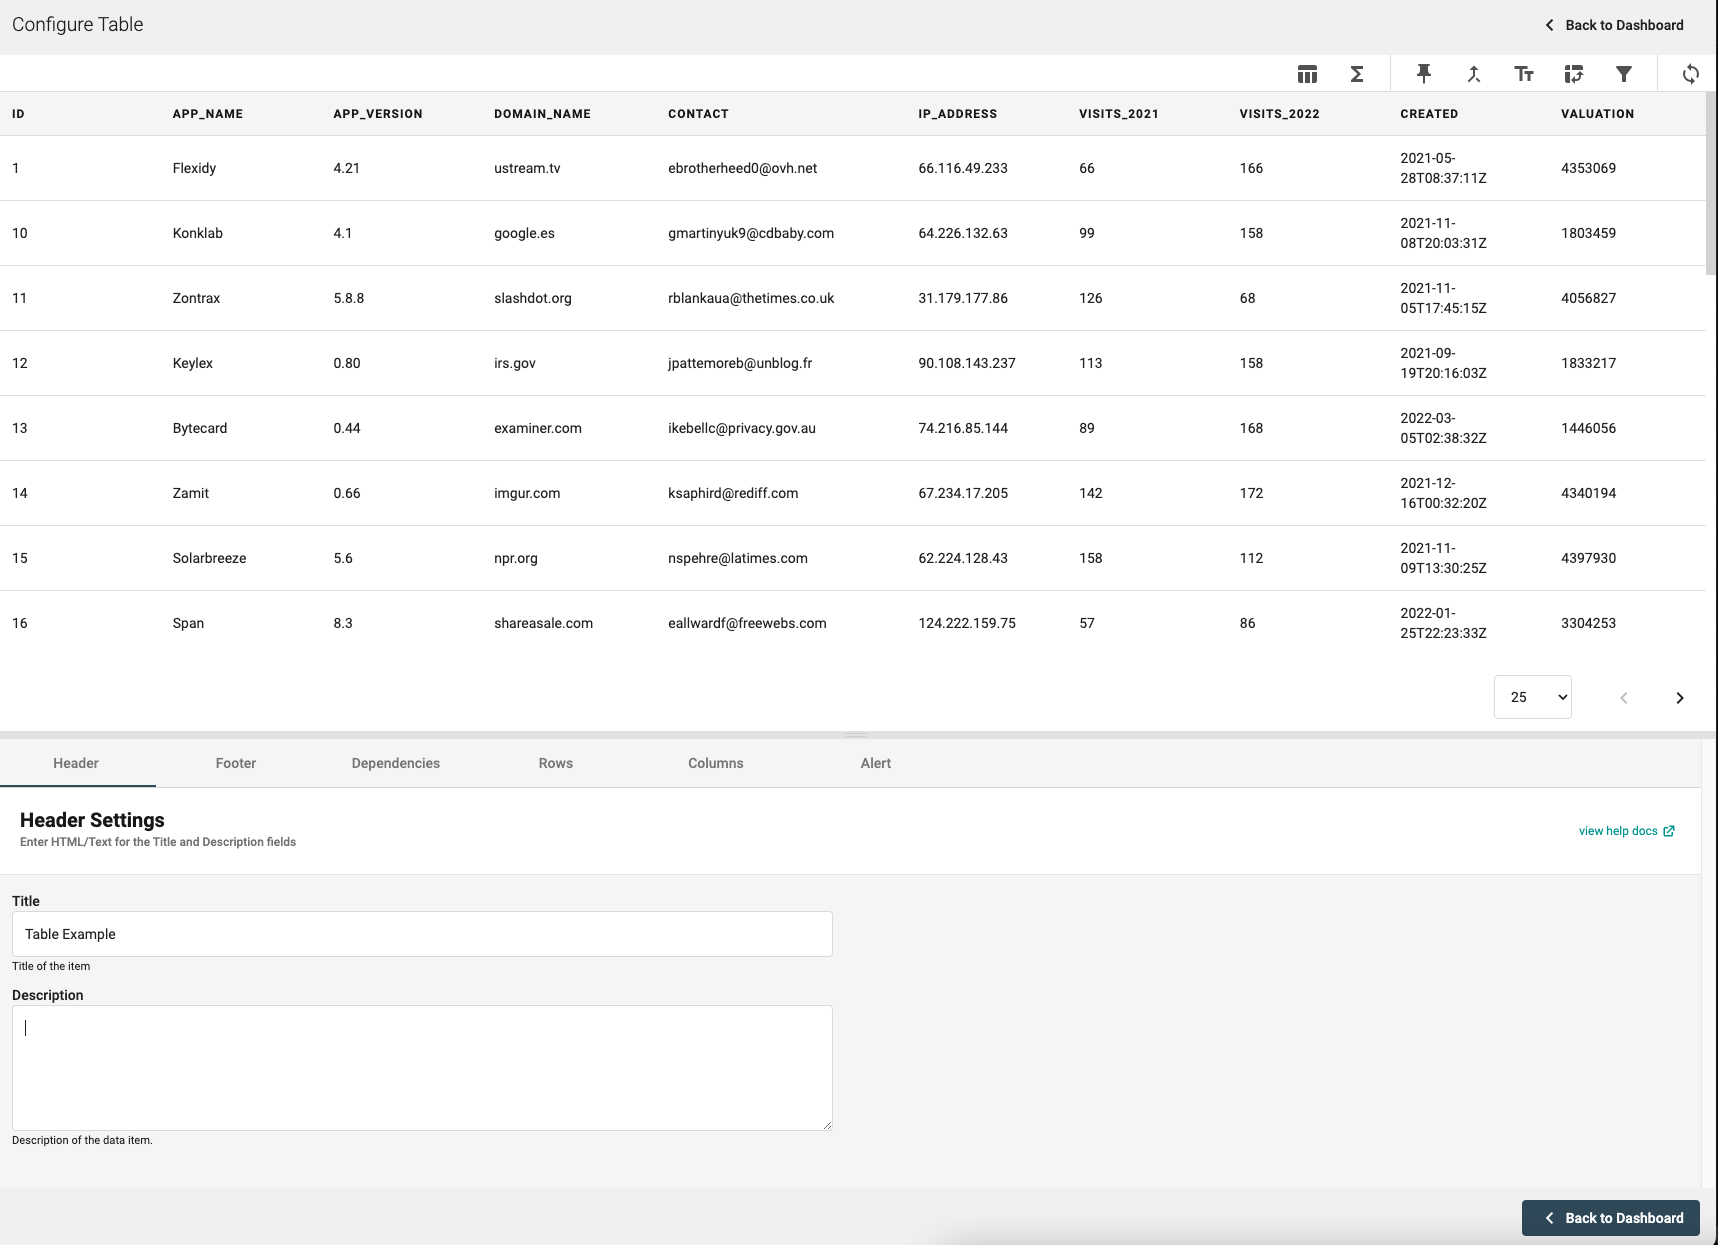
If you select 'Custom Link', then you will be able to type the desired link into the 'Link' box that will appear below.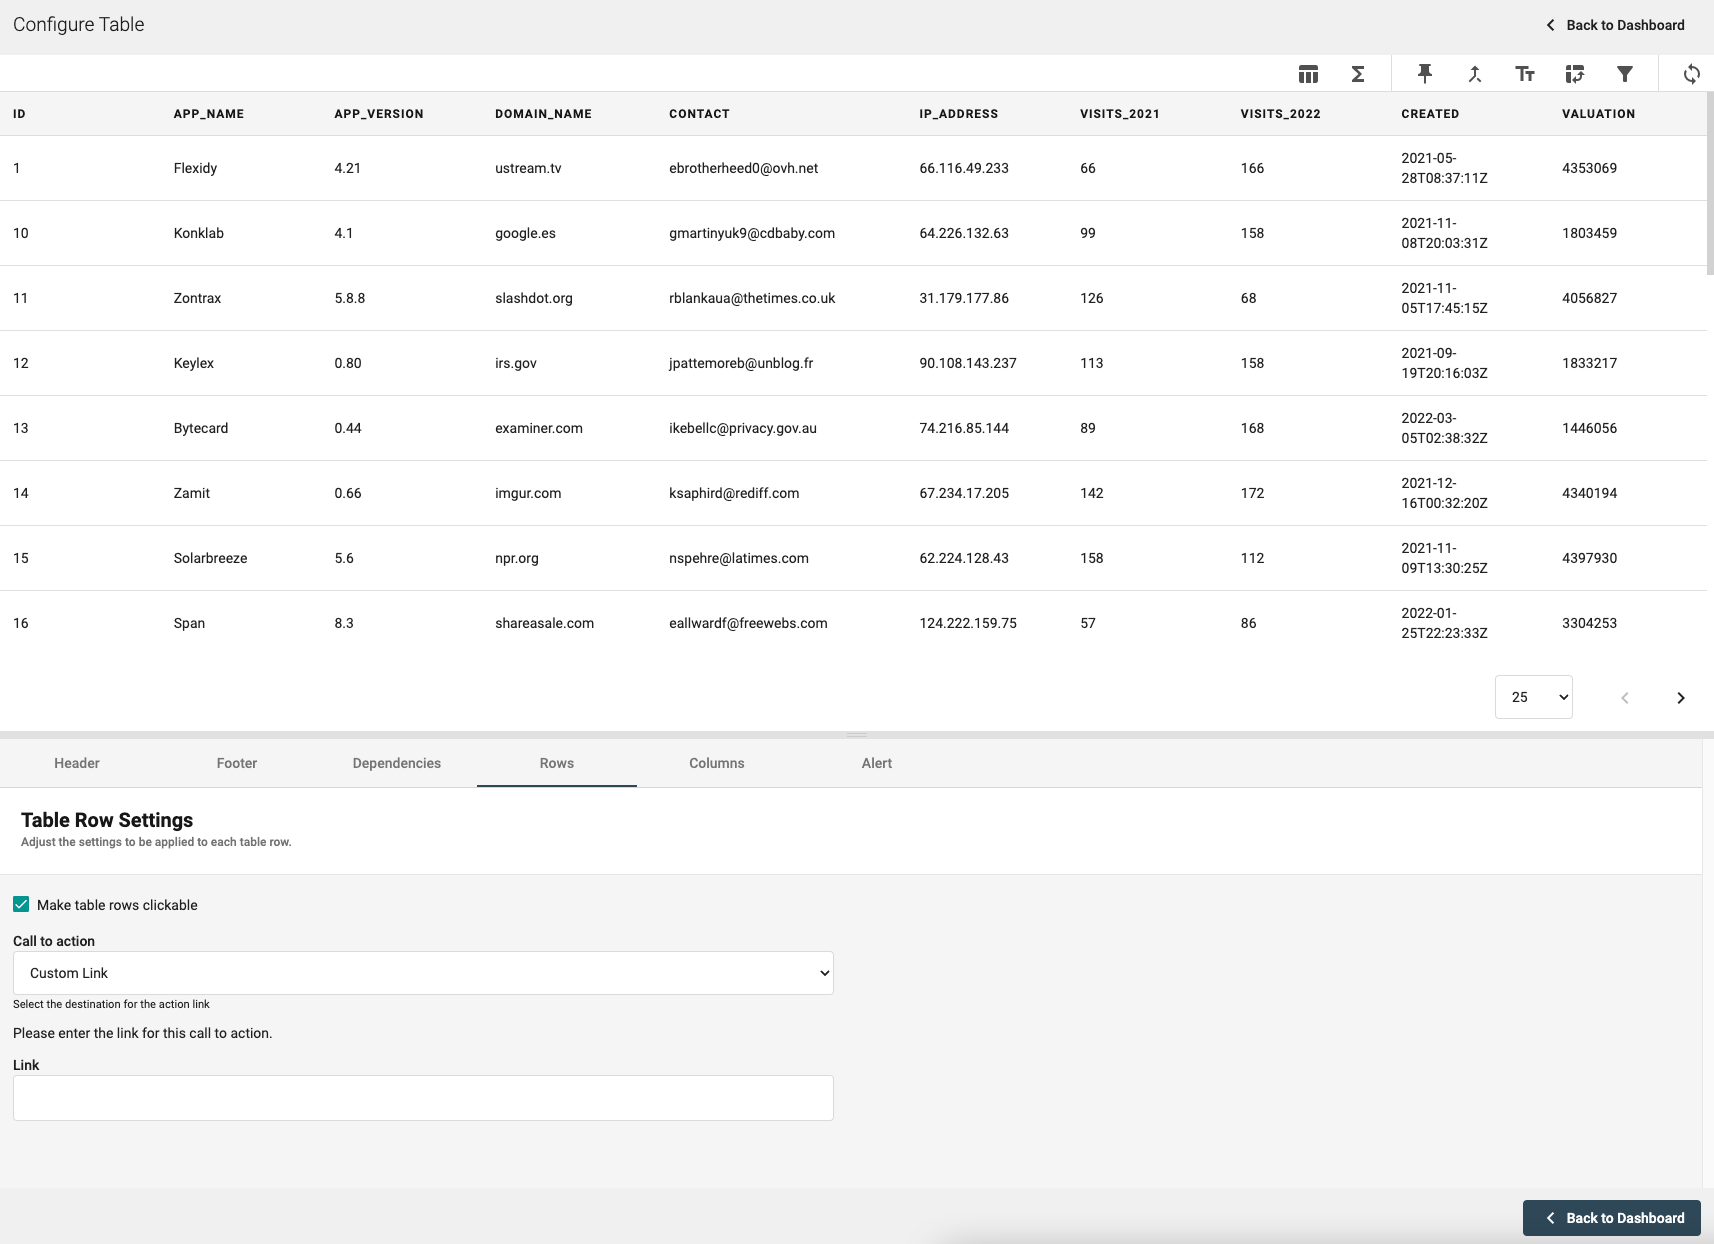
Column Settings Ex 1
Now click on the 'Columns' section. Here you will be able to choose how you would like the data in certain columns to appear. In this example, I want to display the data in the 'valuation' column as a whole number of US Dollars.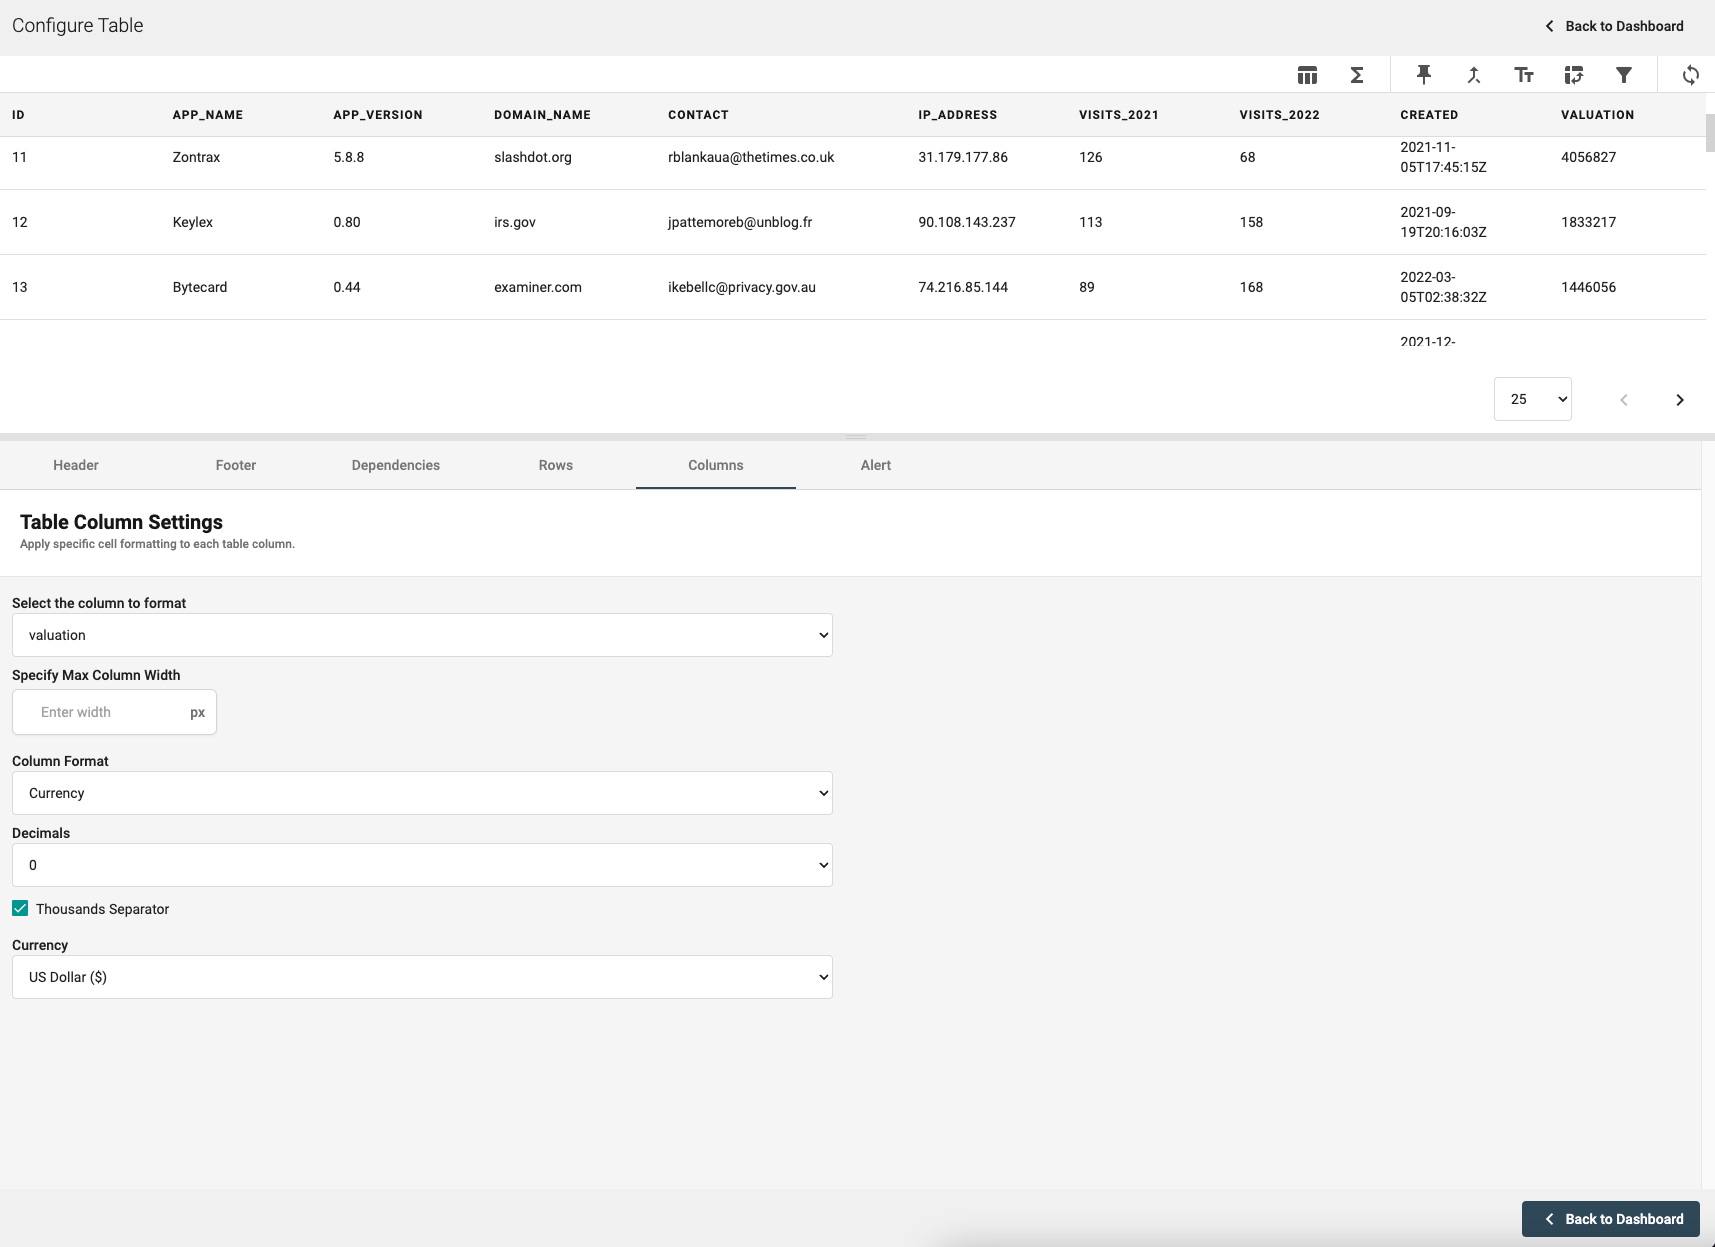
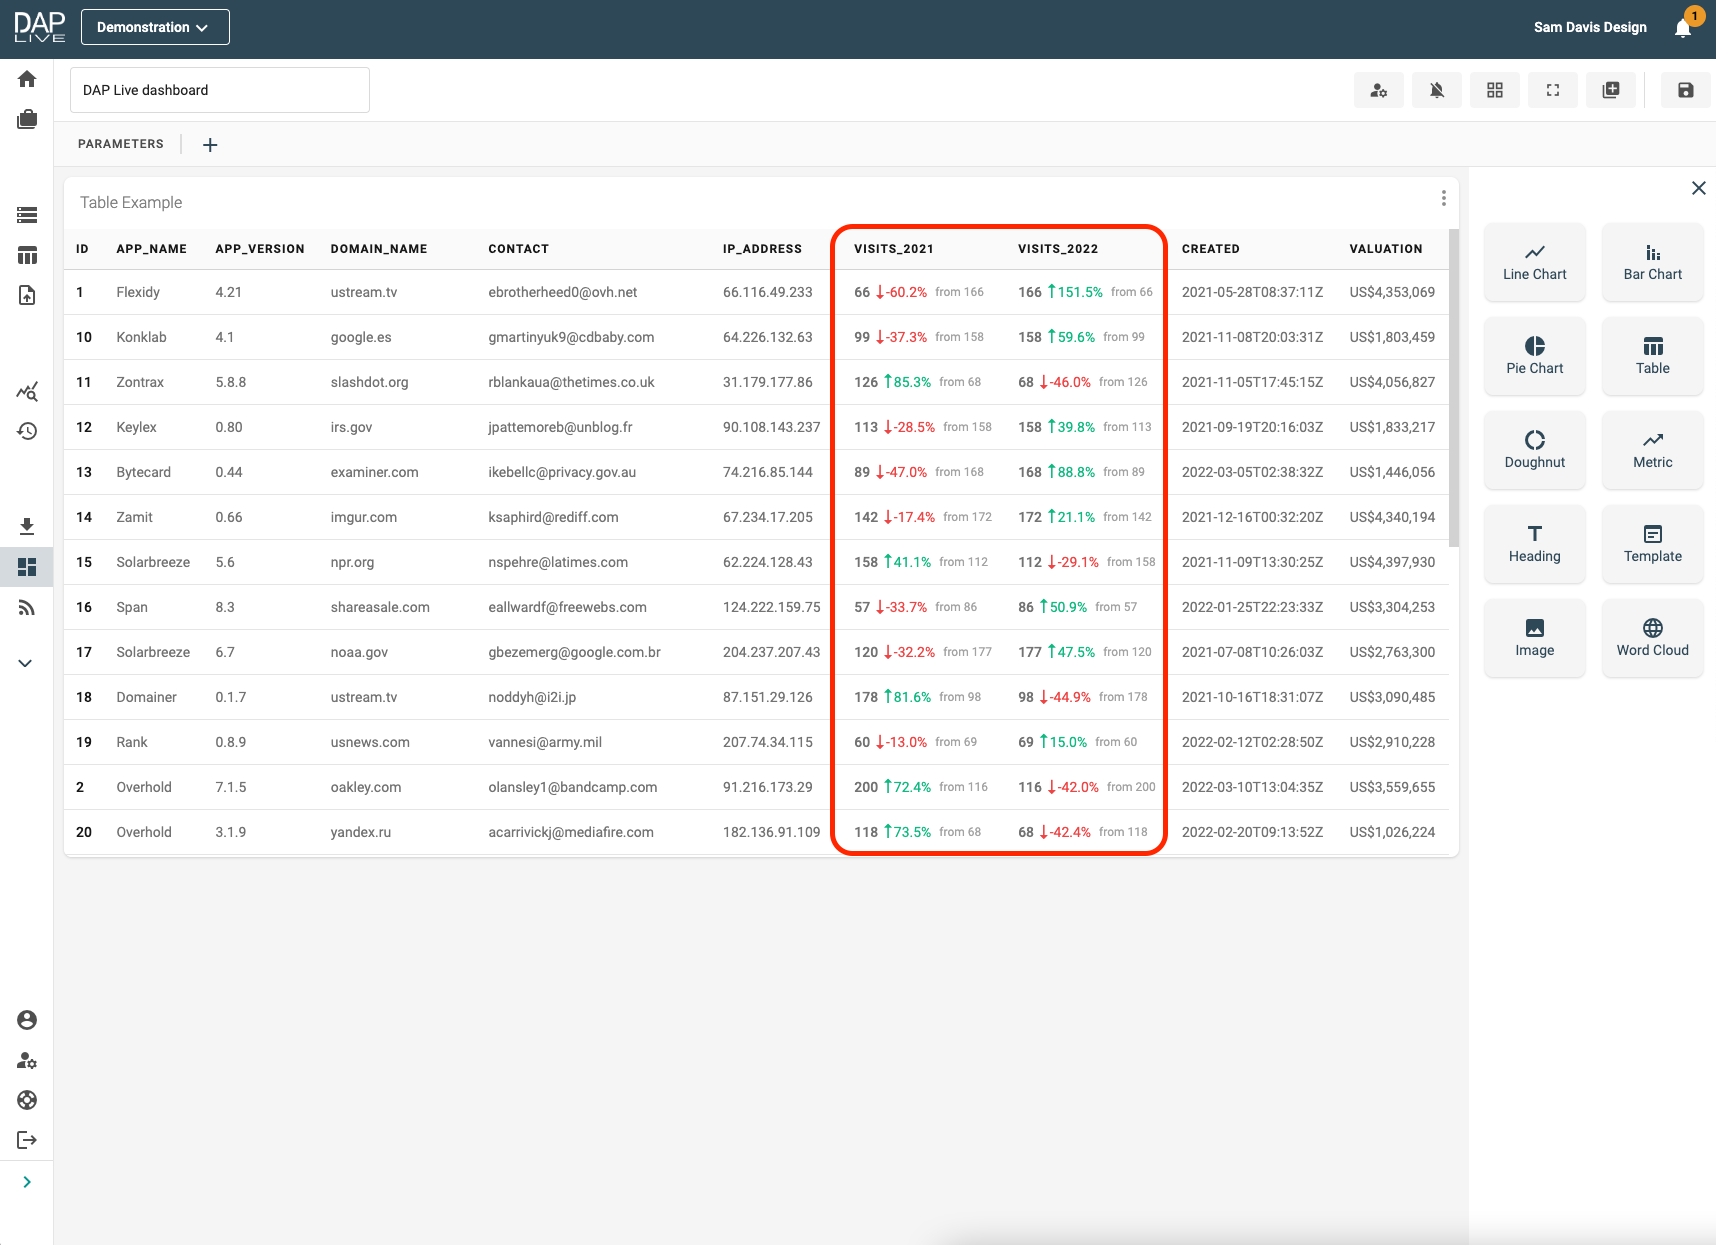
Dashboard Display
After going back to the dashboard, you can now see that the data in that column is now displayed in the desired format.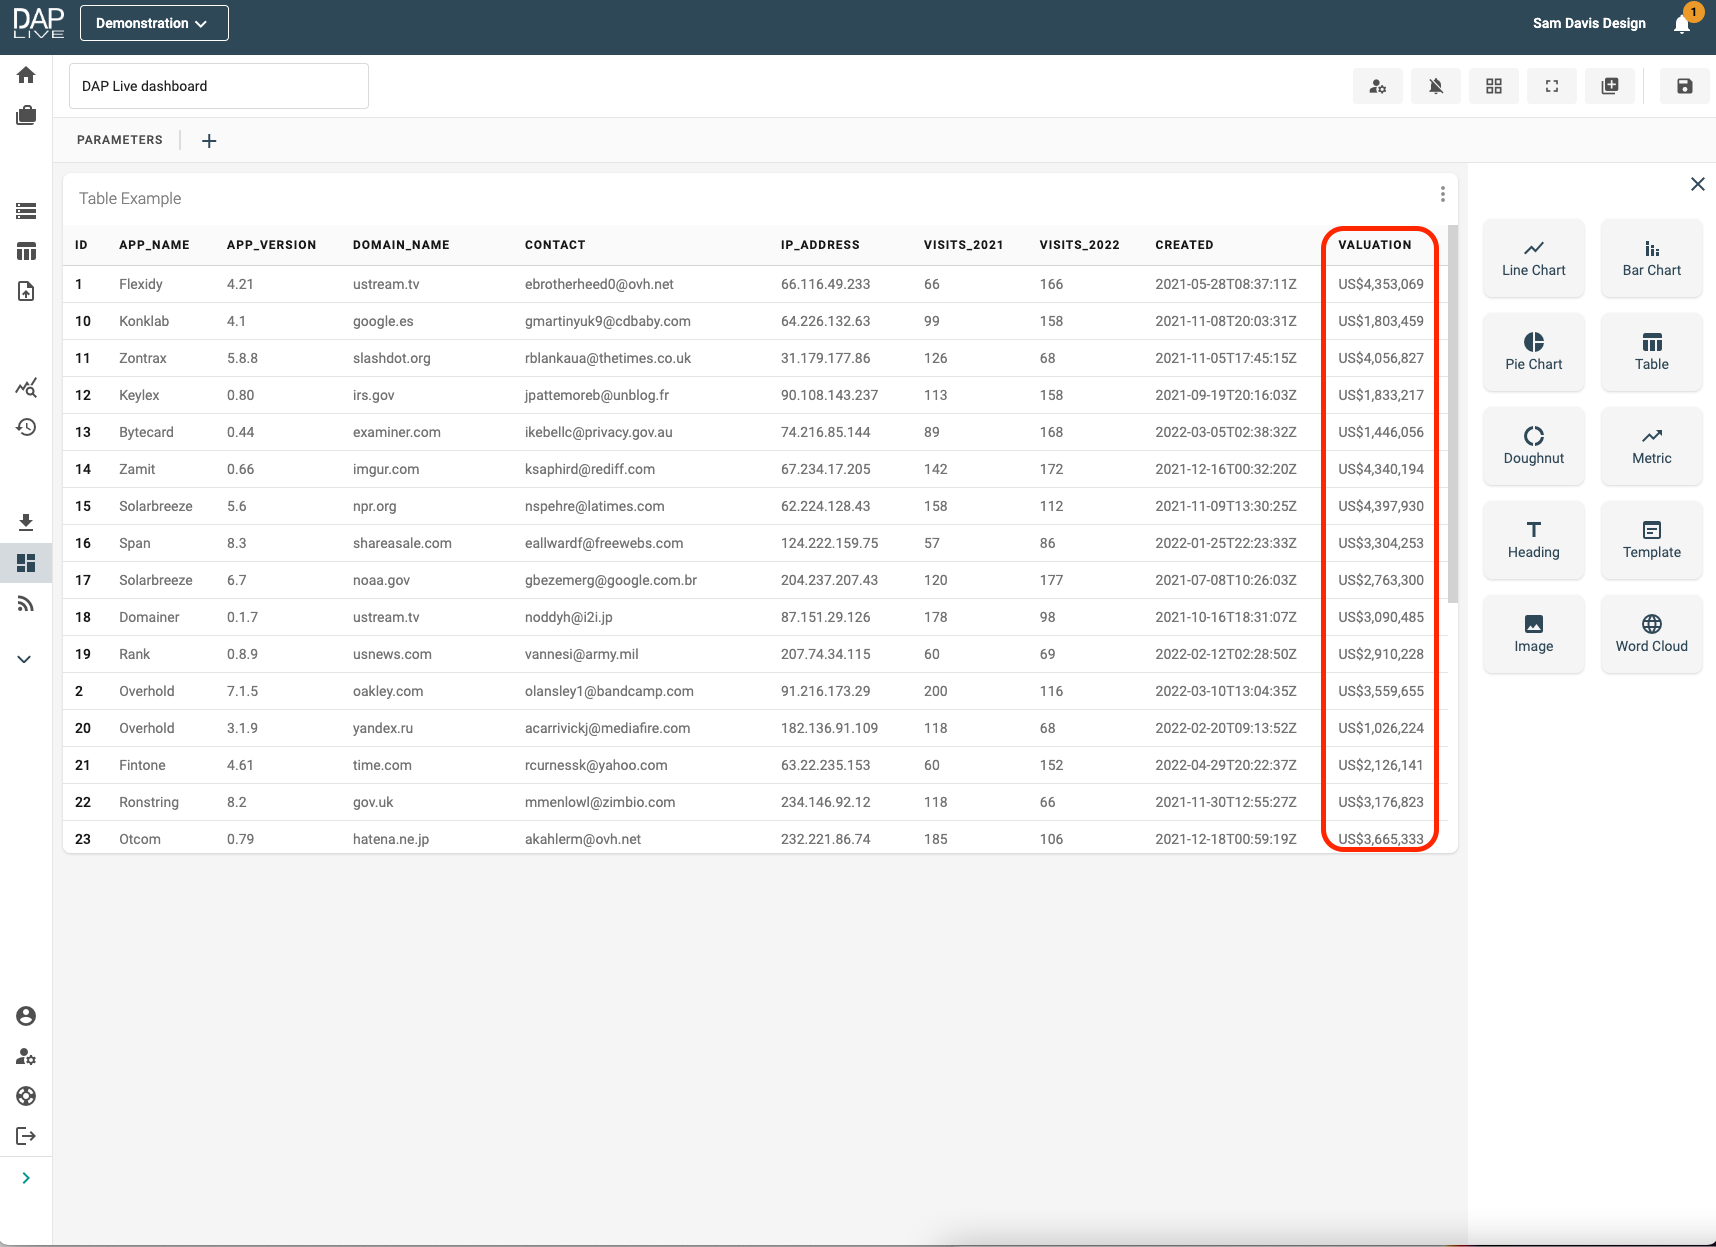
Column Settings Ex 2
In this example, I want the decimal values in my 'Percentage Change In Visits' column to be displayed as percentages to 1 decimal place.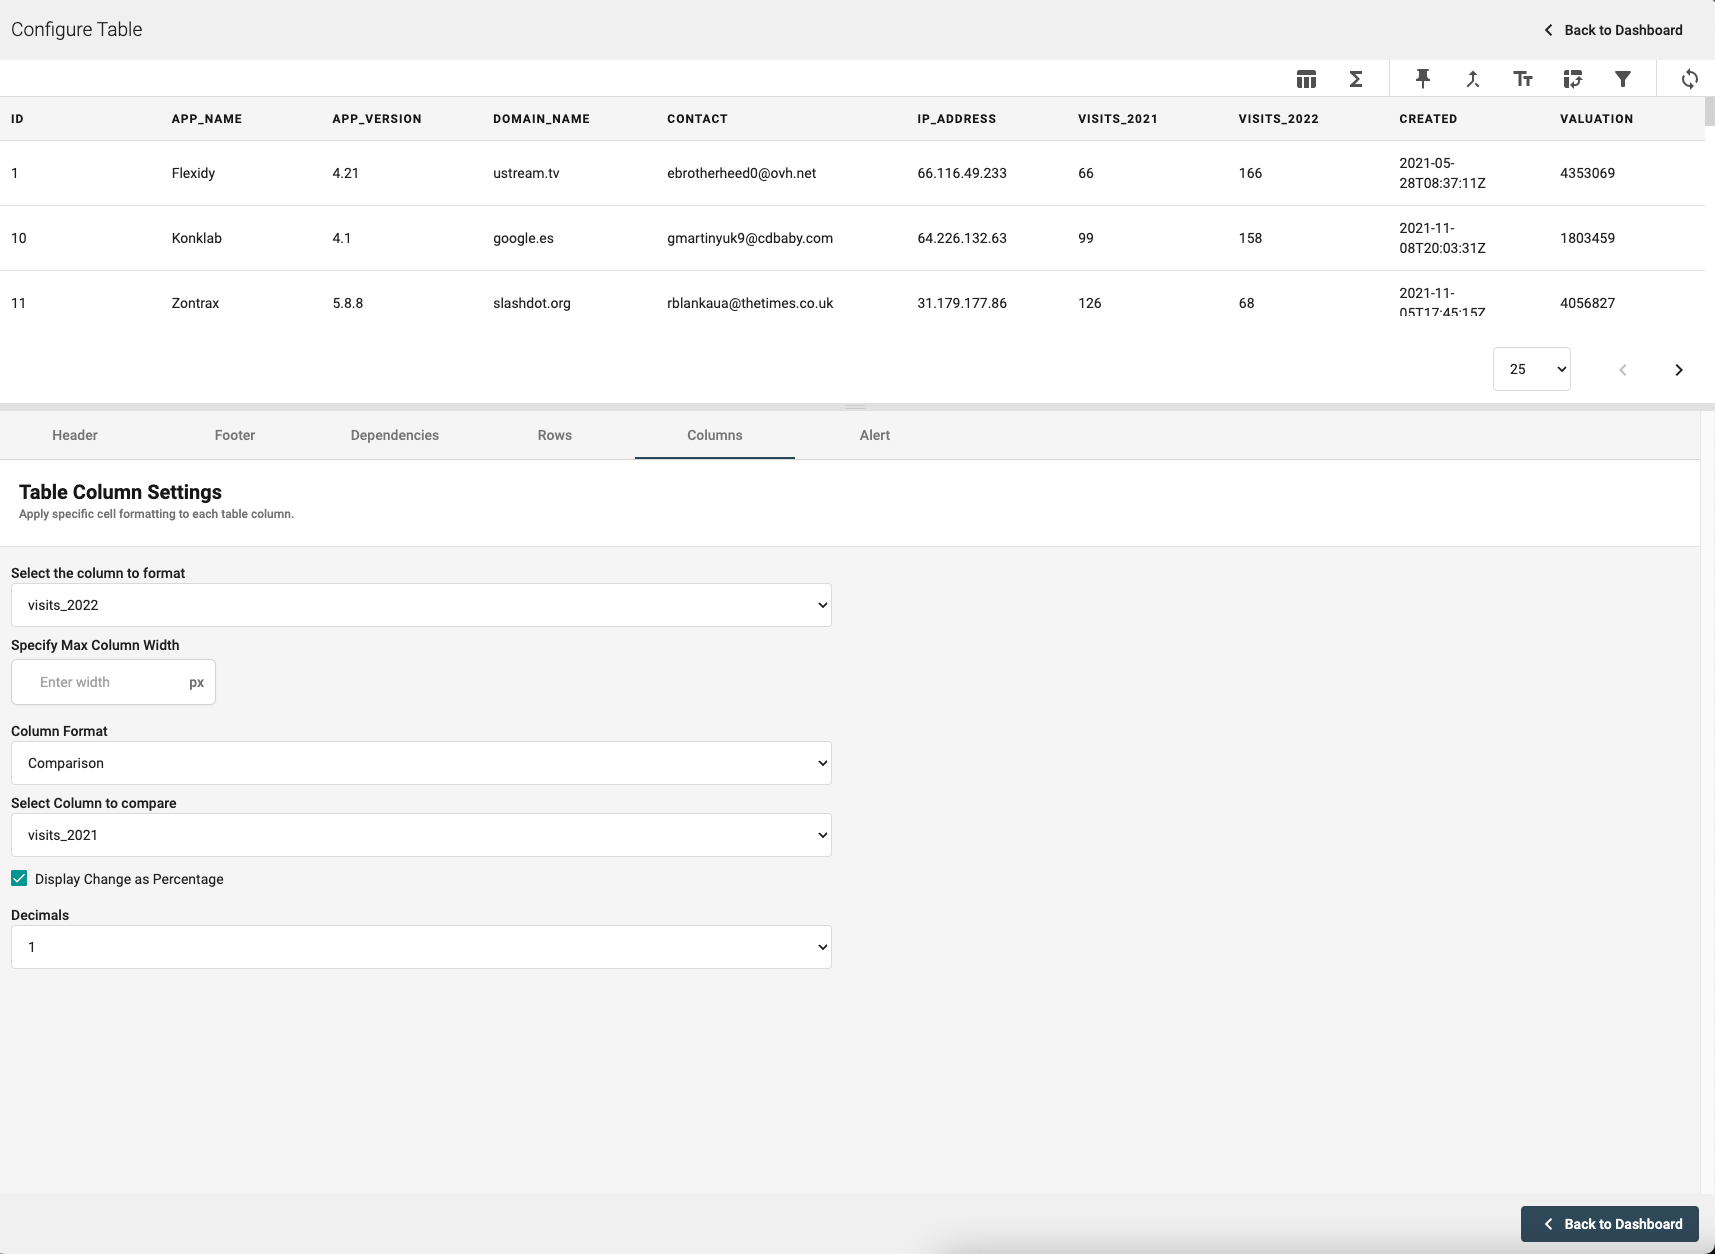
Dashboard Display
After going back to the dashboard, you can now see that the data in that column is now displayed in the desired format.