The DAP.LIVE allows you to import your own data into the system. In this tutorial, we will show you how to manually upload your data.
My Data Section
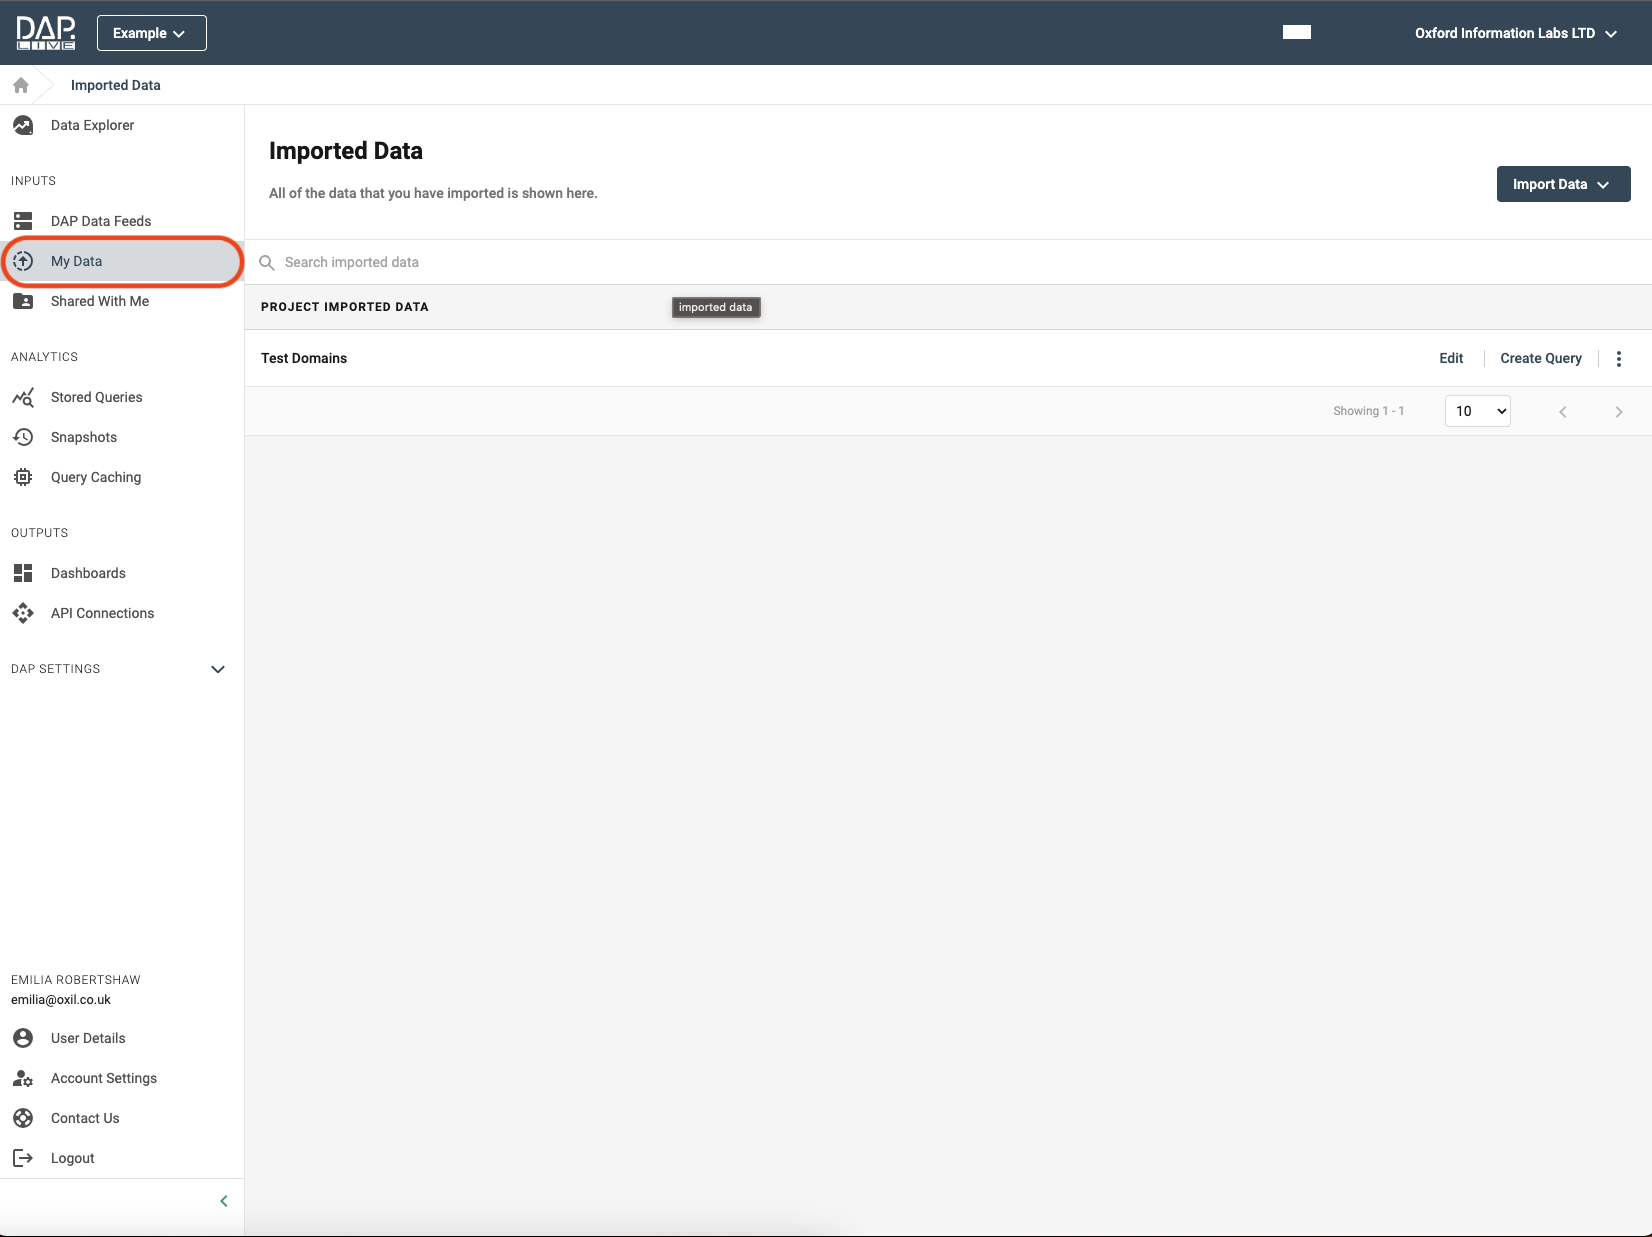
Firstly, you will need to navigate to the 'My Data' section of the DAP.LIVE. You can do this by selecting 'My Data' from the on the left-hand side bar.
Create A New Tabular Datasource
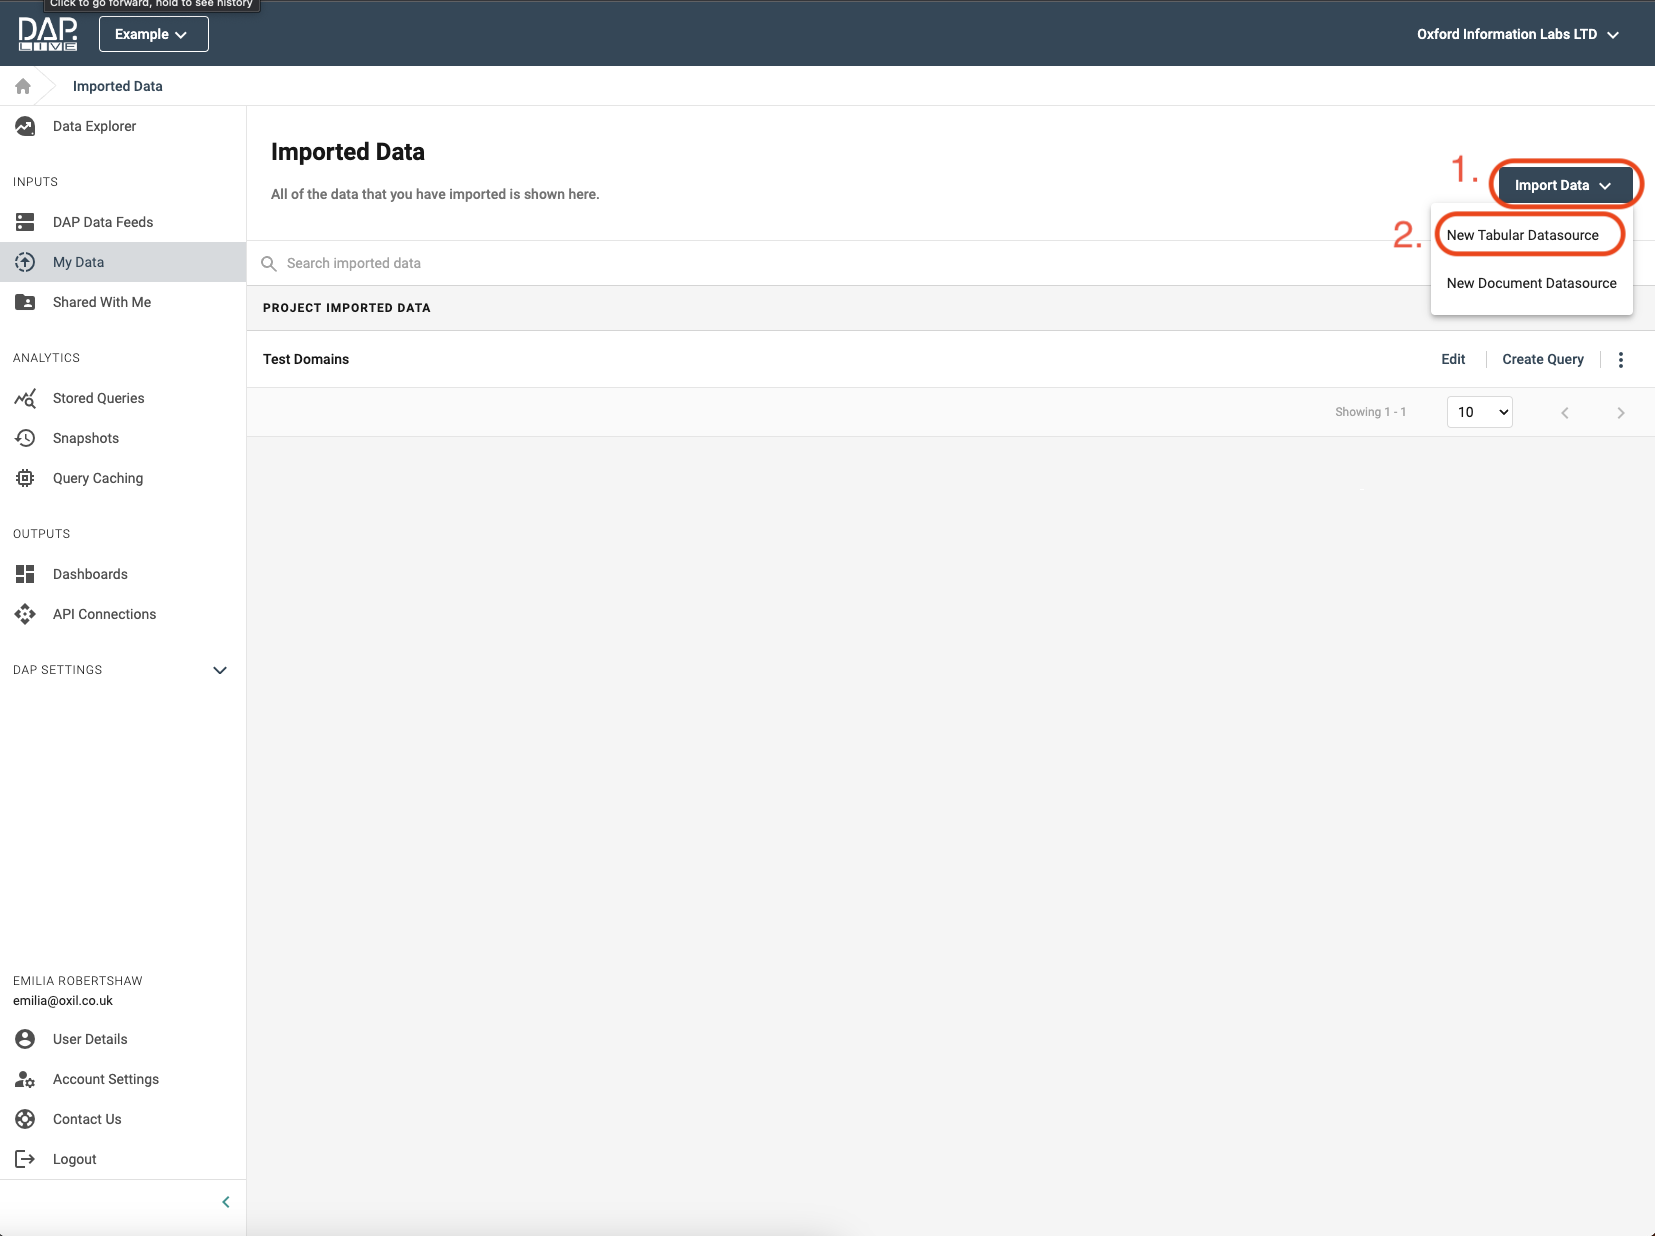
Click on the 'Import Data' button on the top right-hand side of the page and then select the 'New Tabular Datasource' option.
Adding A Title And Column Names
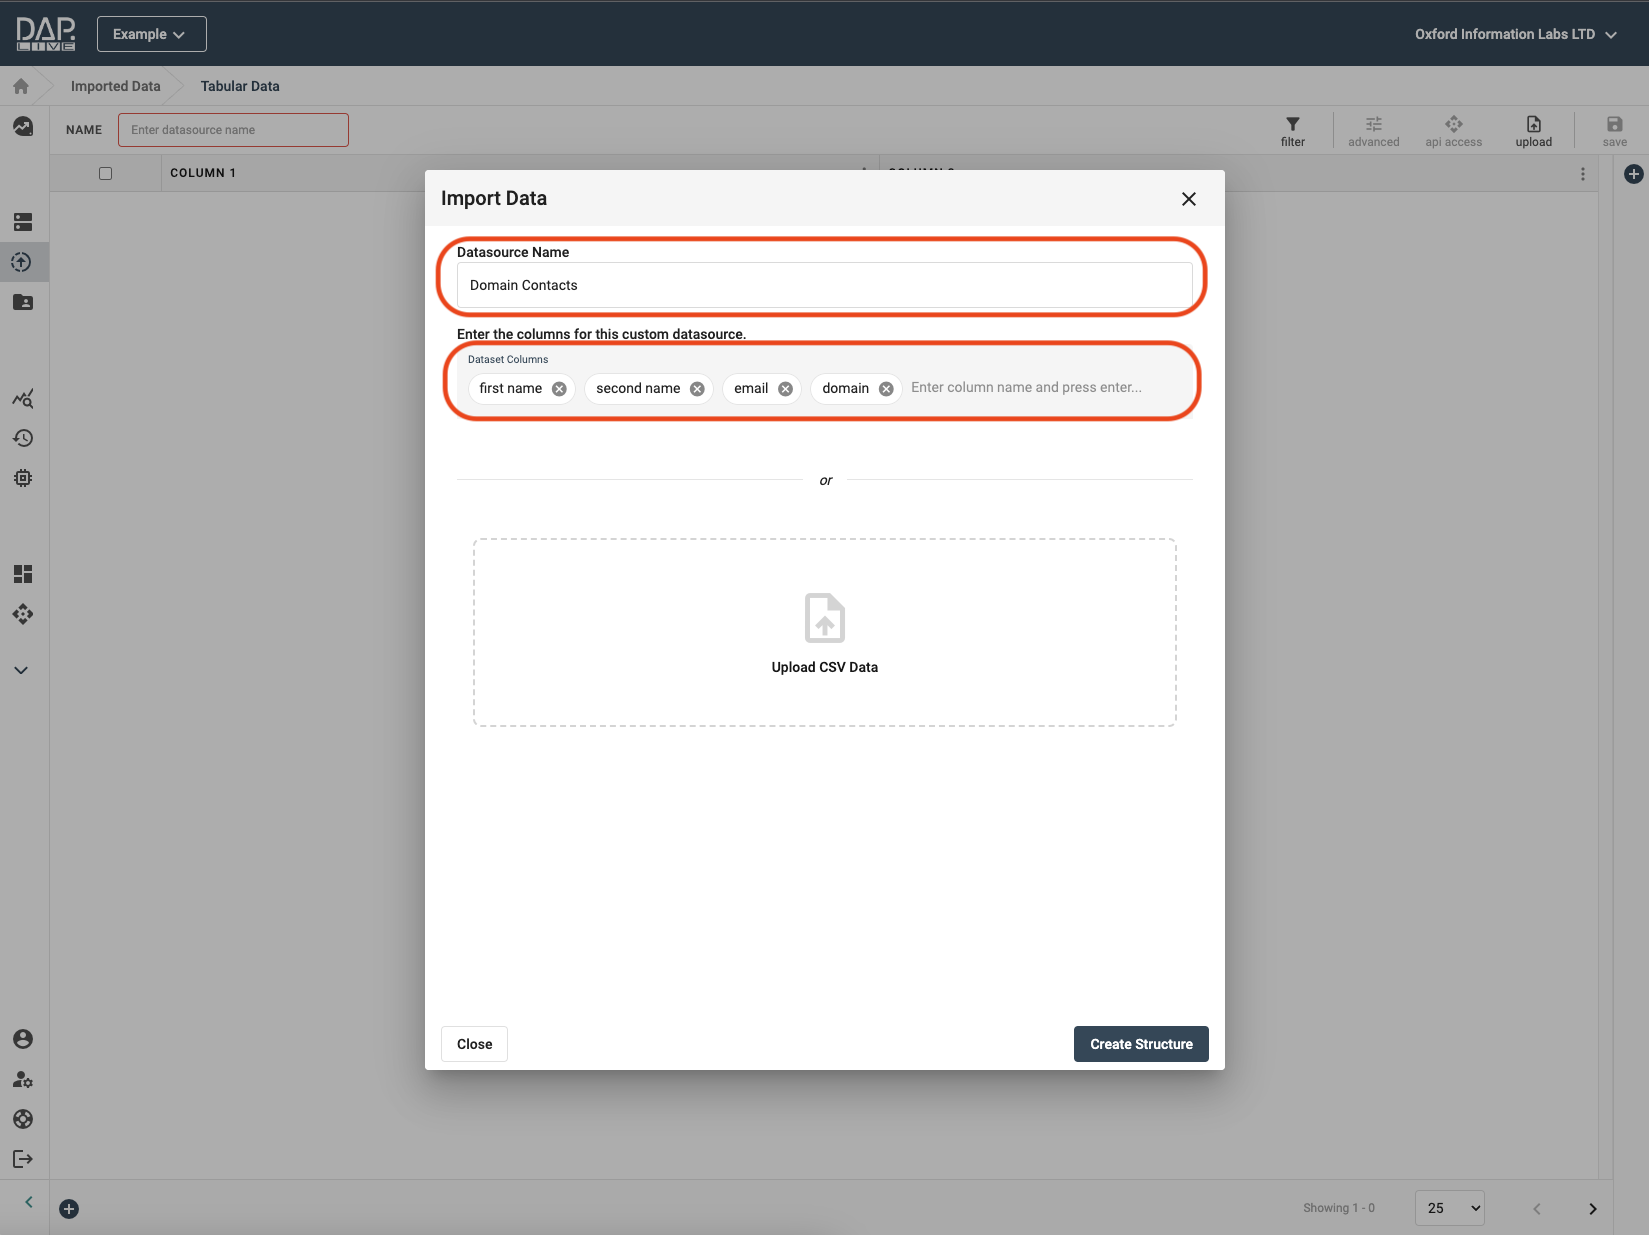
At this point, you can choose to either manually add your data to the DAP.LIVE or to upload it in a CSV file. In this tutorial, we will add the data manually. Please see our guide to uploading your data to the DAP using a CSV file HERE.
Give your new datasource a title and then add the column names into the 'Dataset Columns' box. After you have entered your first column name, press either the enter key or the comma(,) key before moving on to typing out the second column name. You can add as many column names as you need but don't worry if you forget about a column in your dataset and don't add it to the column names list - you can always add more columns later on!
Adding New Rows To Your Dataset
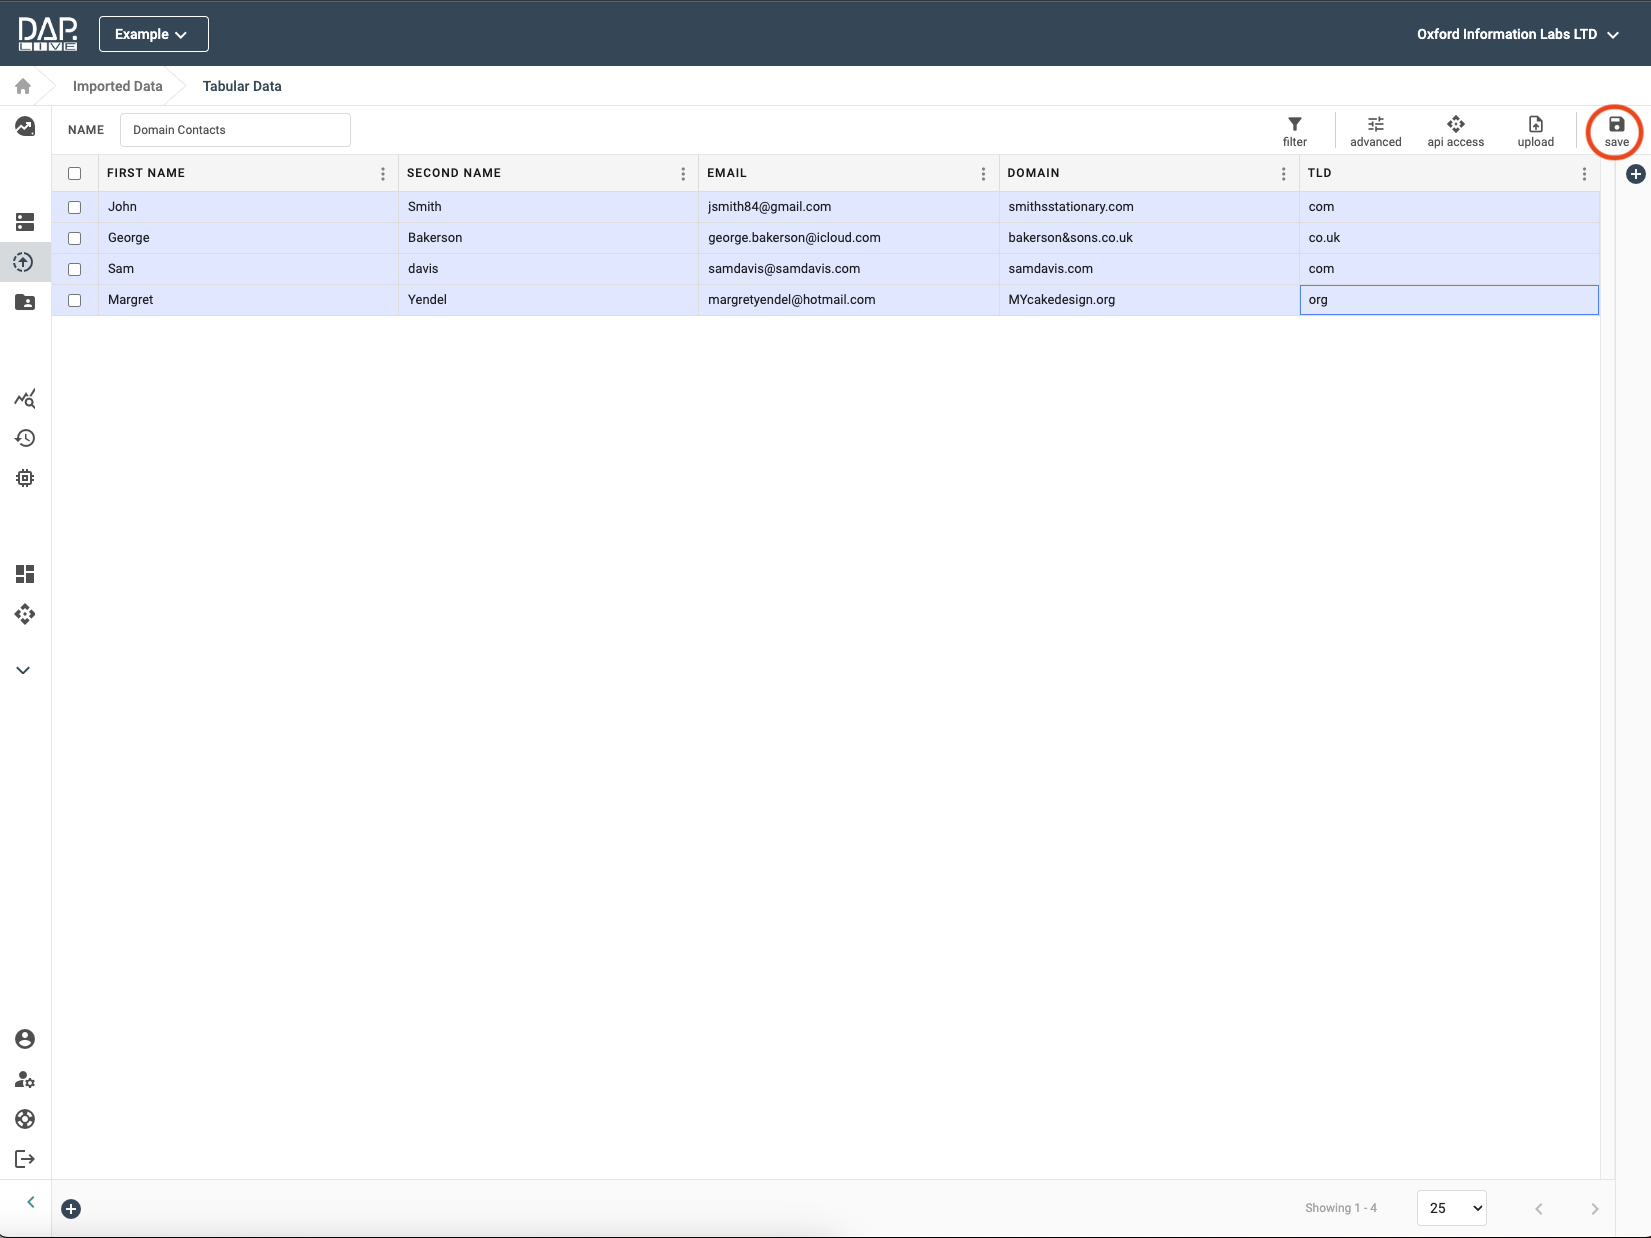
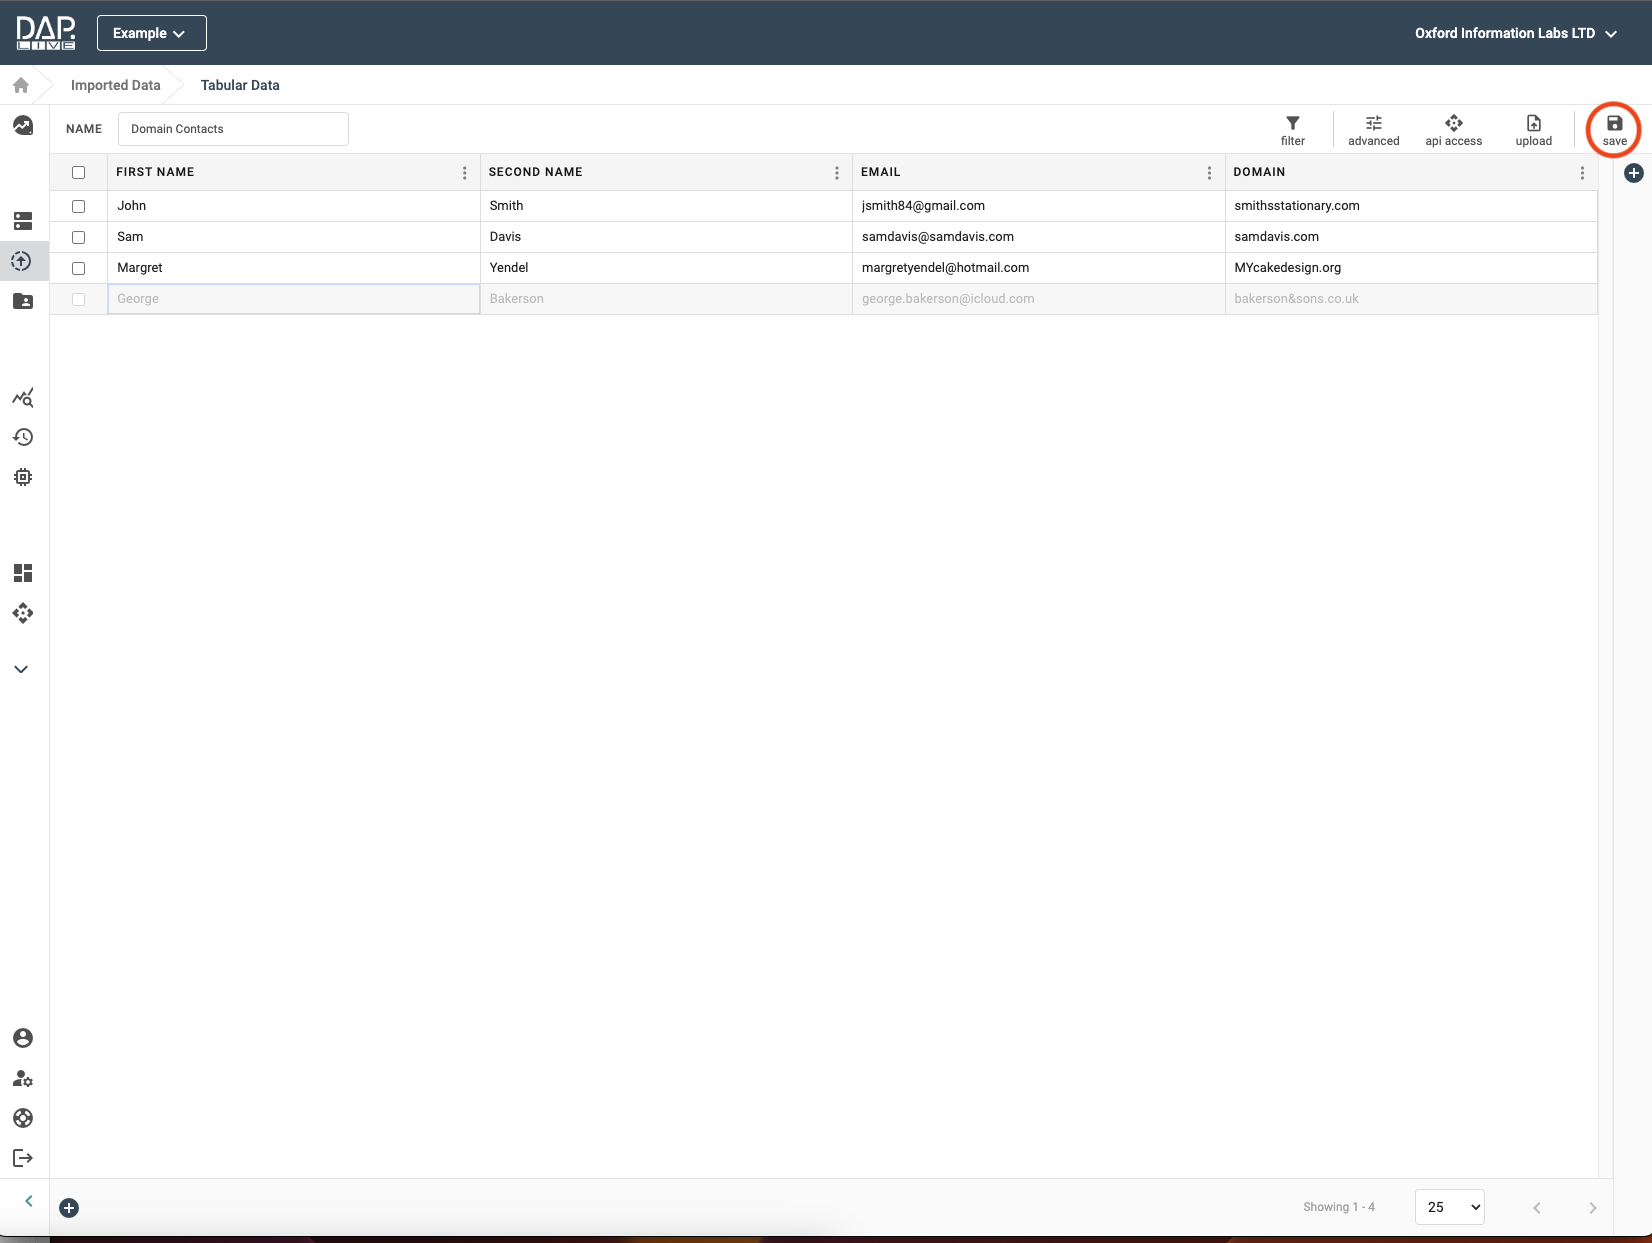
You can add new rows to your datasource by clicking on the '+' sign on the bottom left-hand side of the page. New rows will be highlighted in green until you save them.
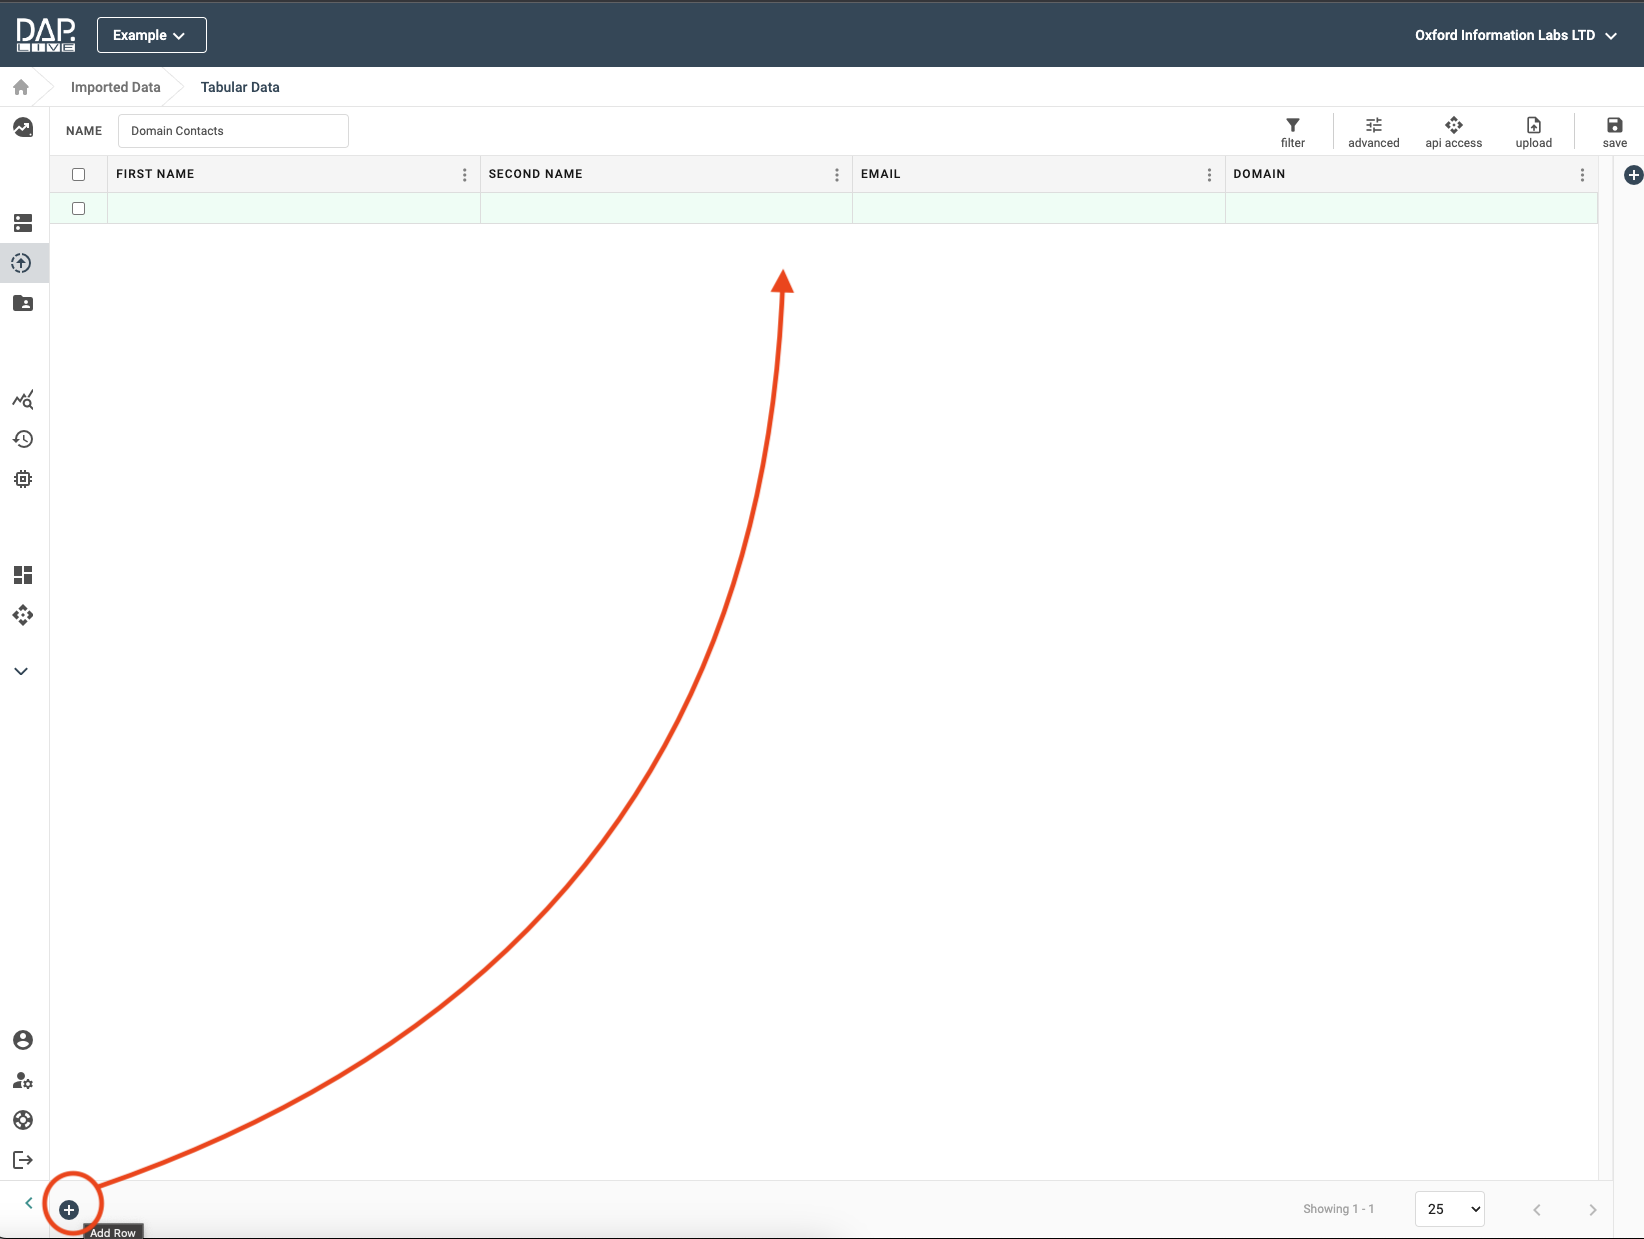
Now simply fill in the rows by clicking in the boxes and typing or pasting in your data.
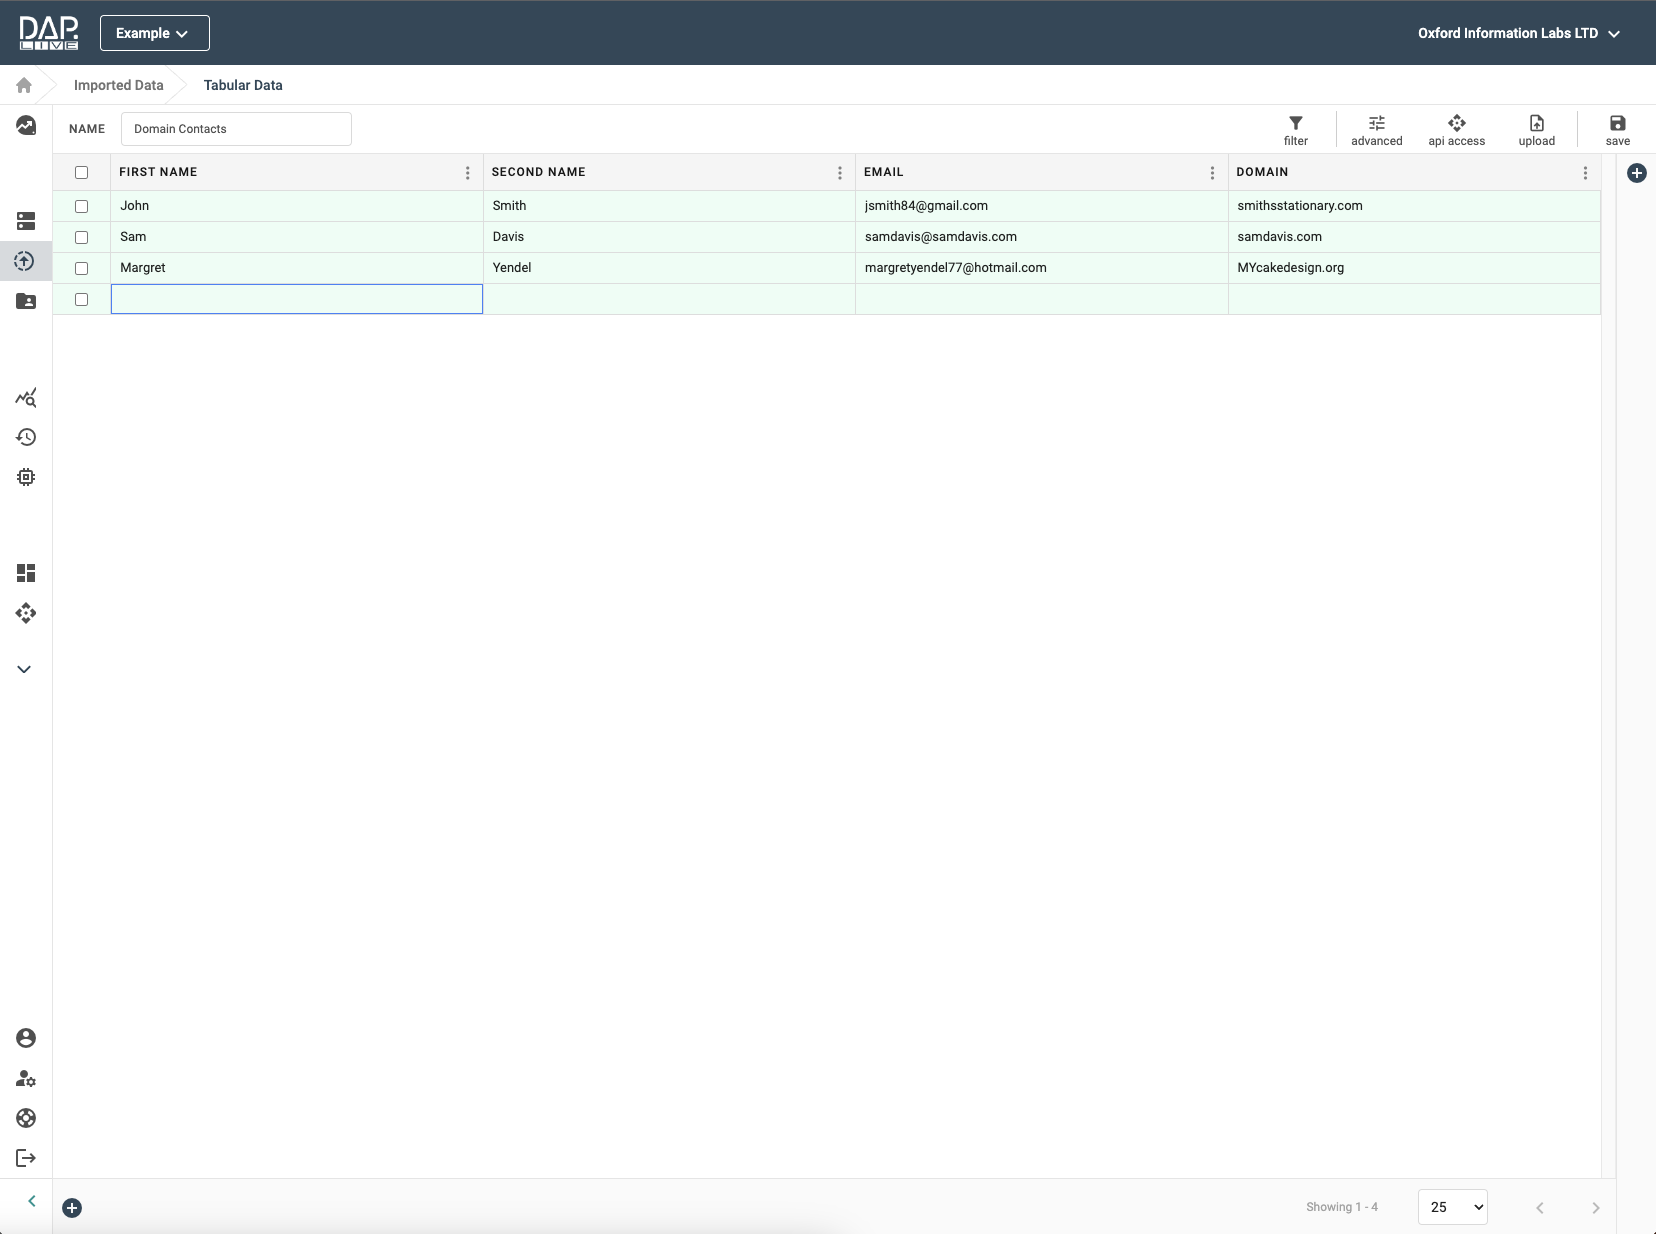
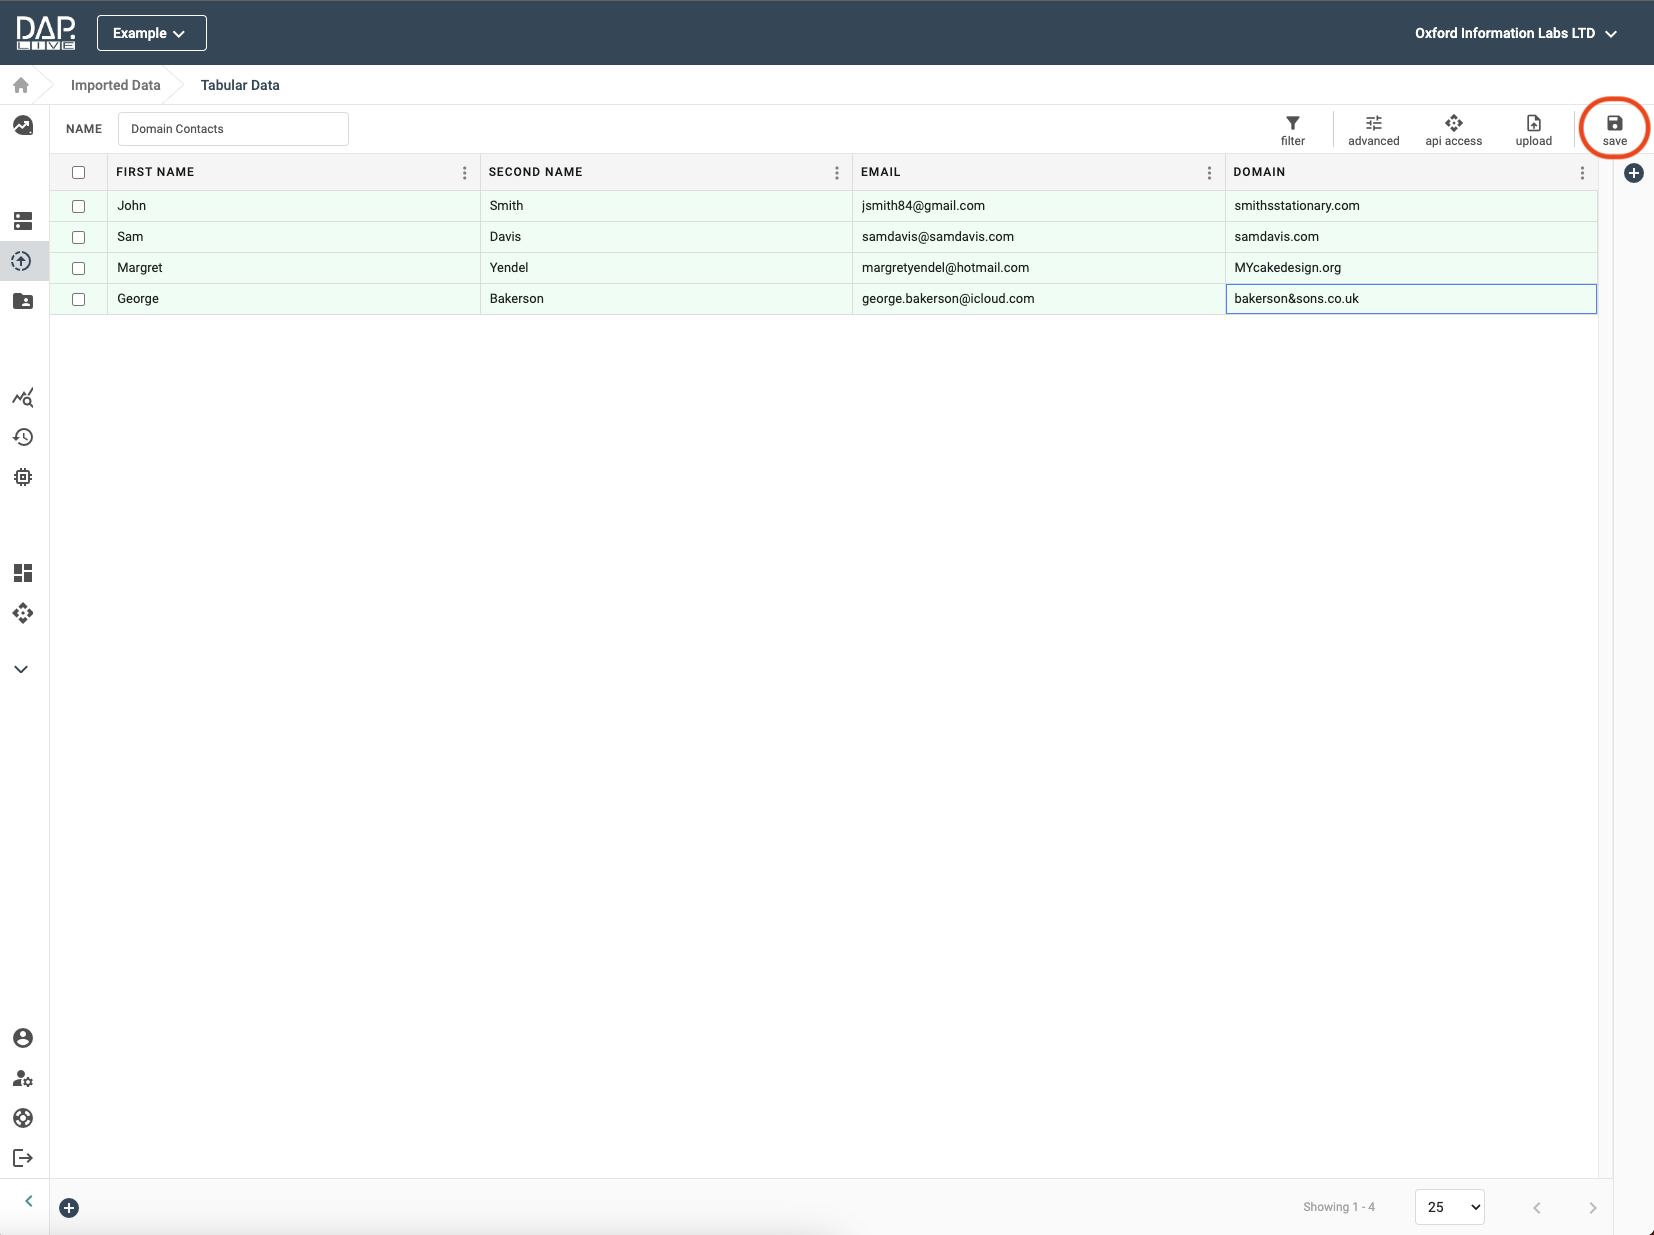
Once you have finished adding your data, don't forget to save your newly added rows by clicking on the save button in the top right-hand corner of the page. Once you have saved your new datasource, all of the green highlighted rows will turn back to white.
Deleting Rows From Your Dataset
If you decide that some of your rows are not needed anymore, you can easily delete them from your dataset, using one of two methods.
If you only want to delete a couple of rows, you can simply click on the three dots next to any data entry in that row and then select the 'Delete Row'.
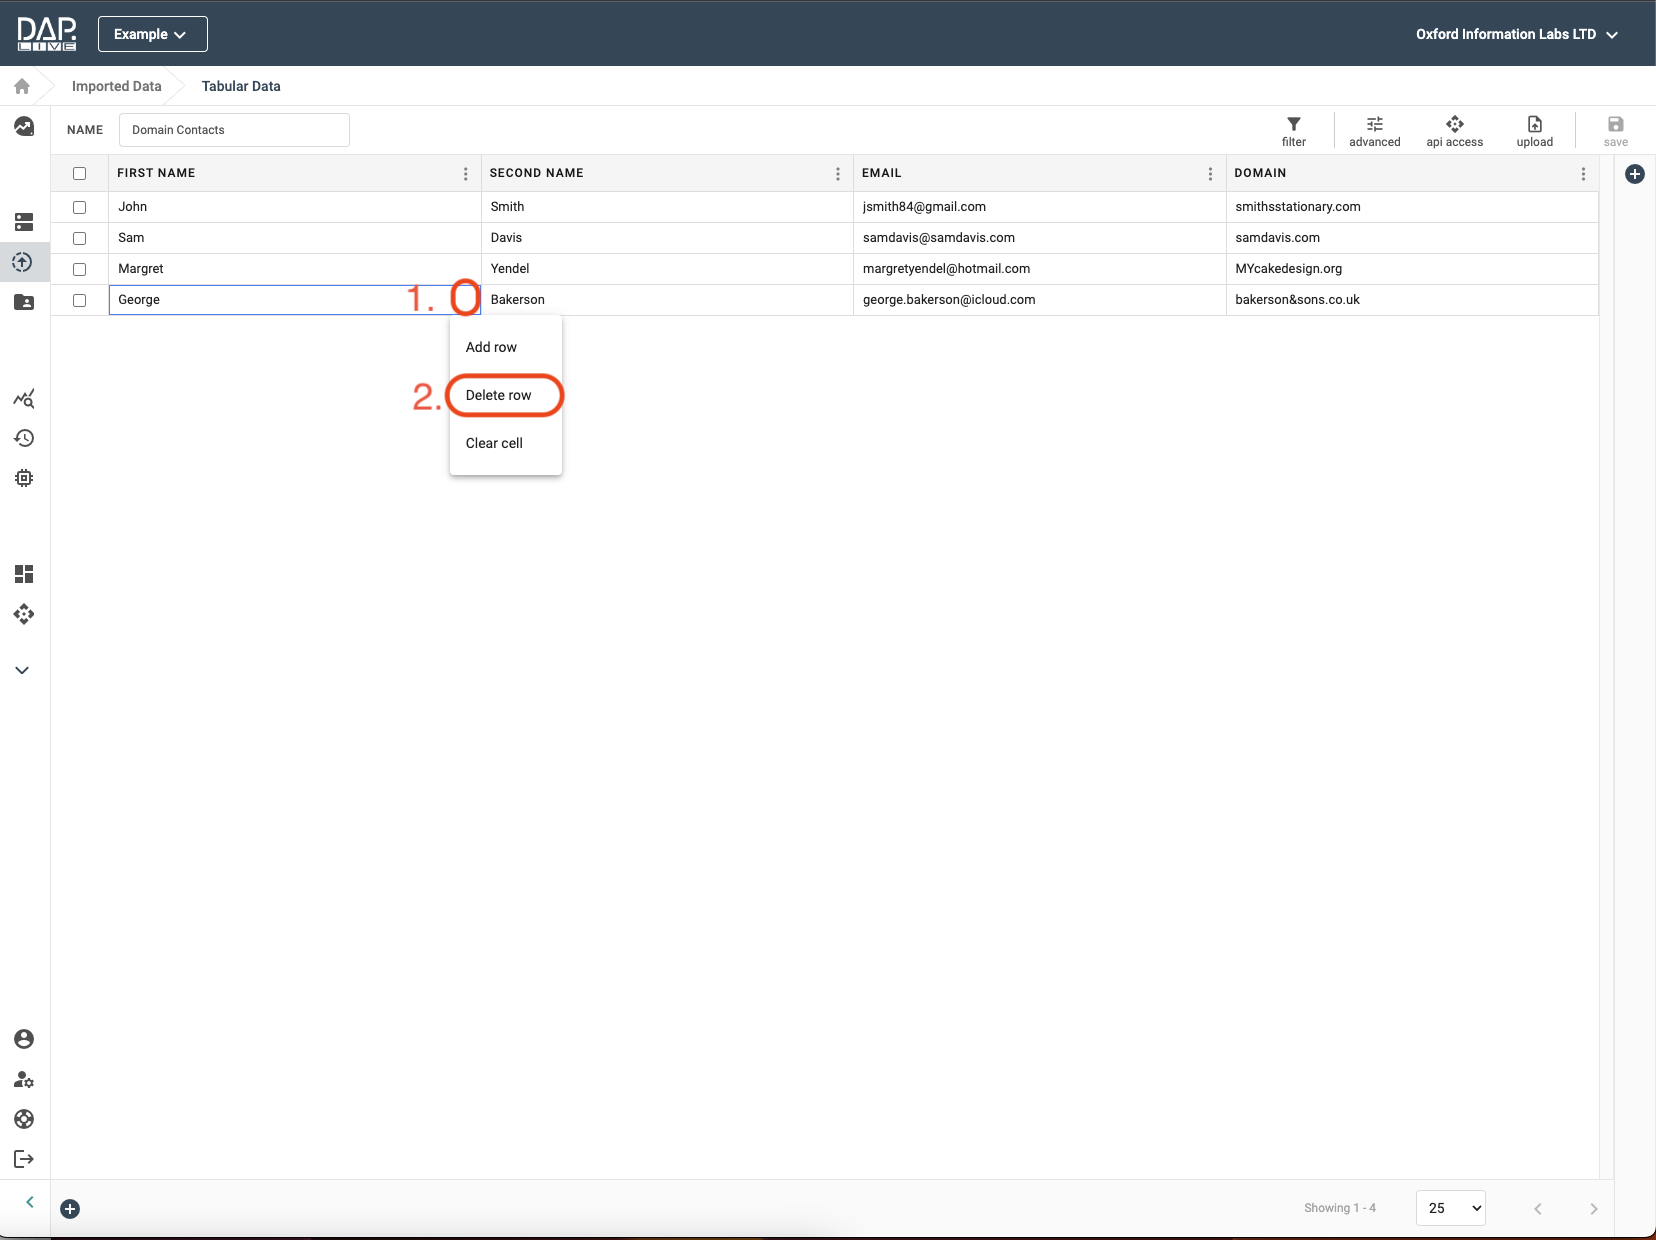
As you can see, this row is now greyed out, indicating that it has been deleted. Save your updated datasource by clicking on the save button in the top right-hand corner of the page. Once you have saved, the grey highlighted rows will be permanently deleted.
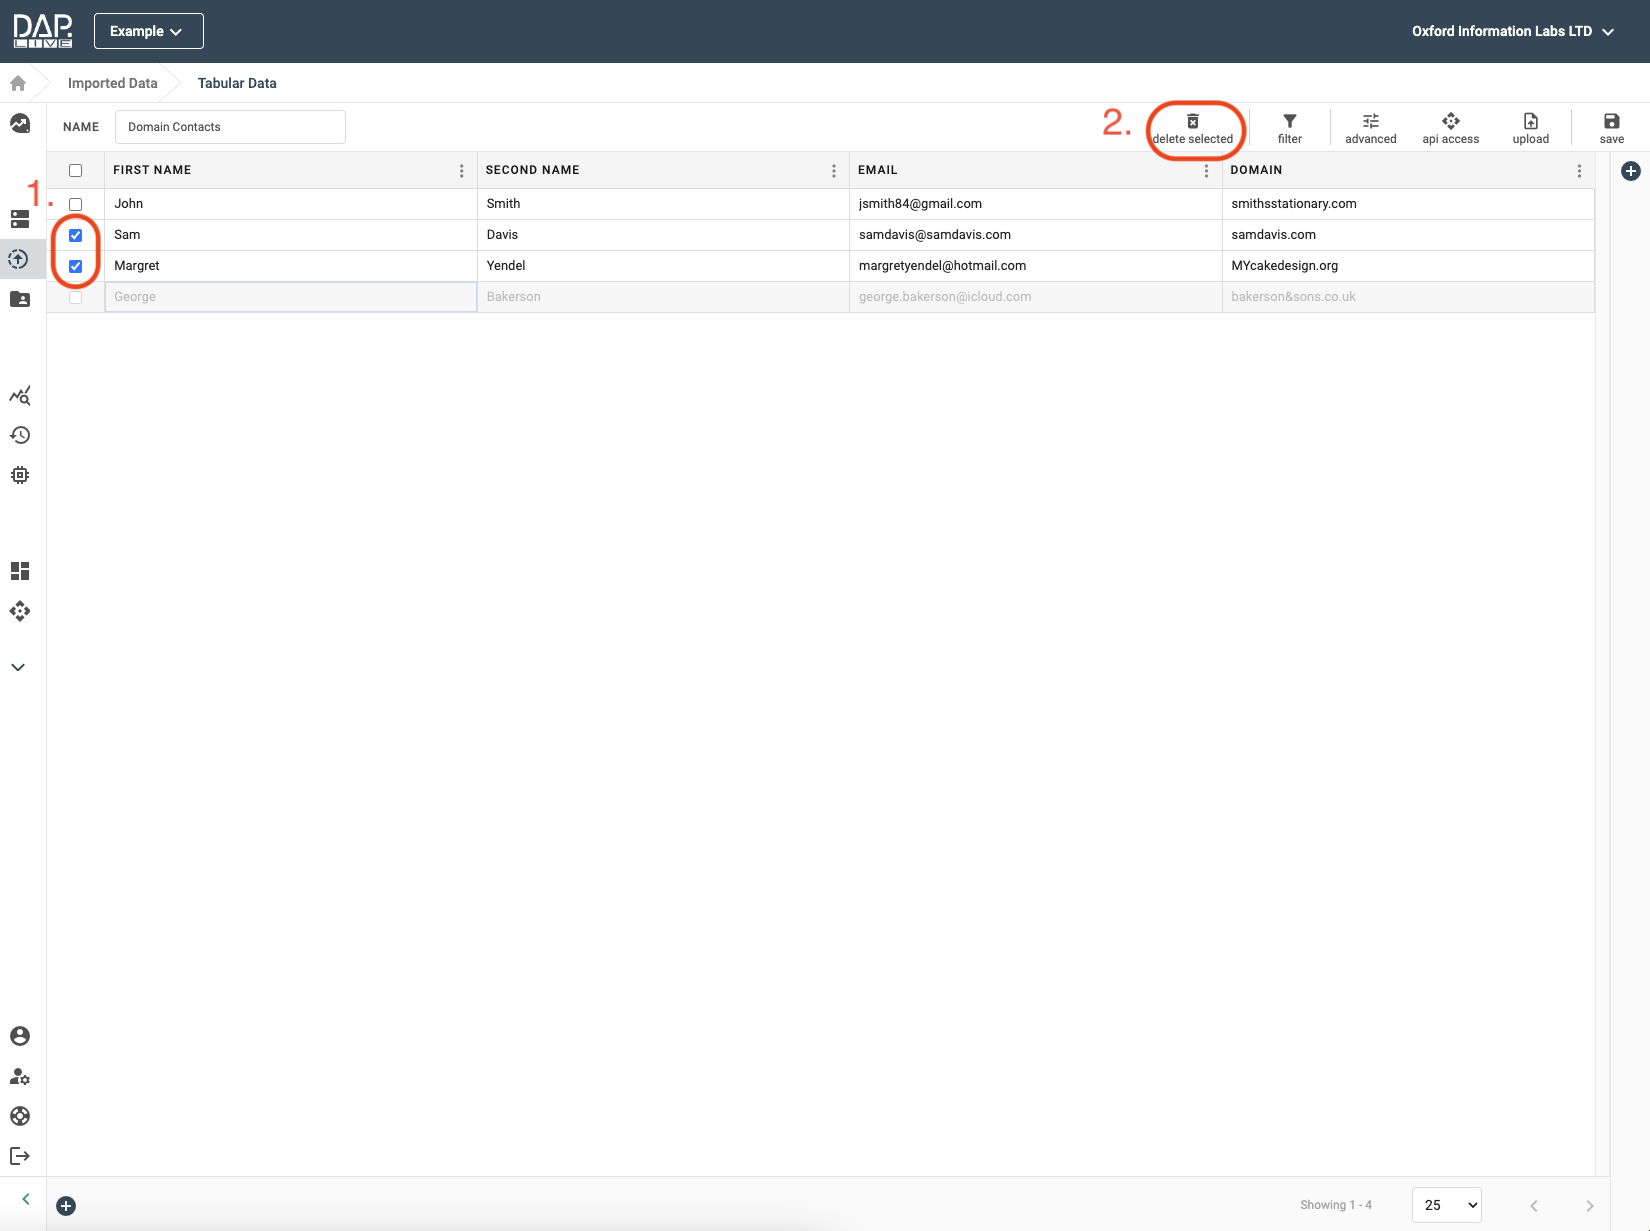
Alternatively, if you are deleting multiple rows at a time you can click on the tick boxes to the left of each of the data entries. Once you have selected all of the rows that you want to delete, simply click on the 'Delete Selected' icon near the top of the page. These will be deleted immediately.
Editing Rows In Your Dataset
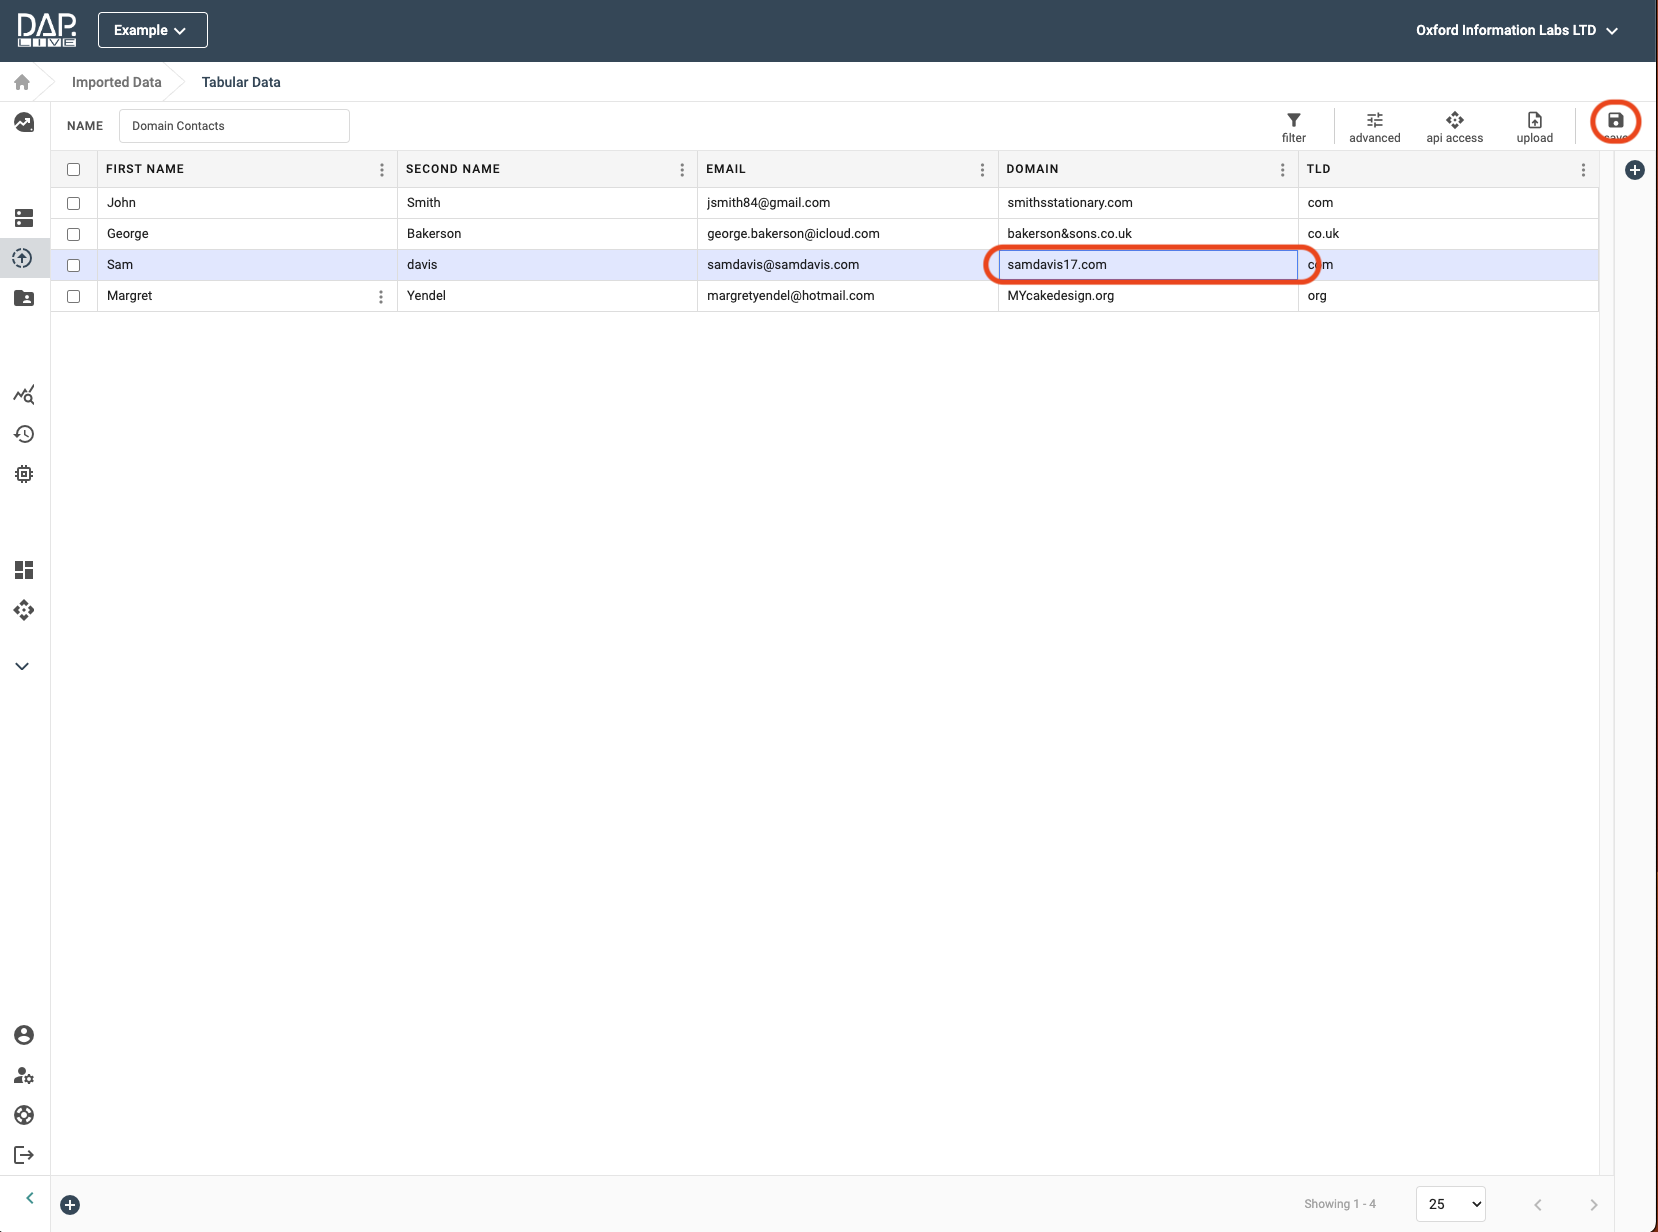
If you want to change some of your data without deleing and re-adding rows, you can just click on the data box and edit the data inside. Any edited rows will be highlighted blue until you save your changes by clicking on the save button in the top right-hand corner.
Adding Columns
If you want to add another column to your datasource, you can click the '+' sign to the right of the column headings. From there you can add your column title and select the type of data that this column will contain.

Now you can fill in the data for your new column and save this using the save button. The blue highlighted rows that have just been modified will now turn back to white.